Highlights
Table of contents
Part I: Introduction
Employer-sponsored training is a critical component of Canada’s overall skills development landscape, which includes formal and informal education and skills training. It helps bridge gaps between formal education and the specific skills required in workplaces, including gaps that emerge from technological, regulatory, and other economic and social changes. Training helps employers improve productivity and product and service quality. It also contributes to a culture and practice of lifelong learning that supports employees’ skills development and improves opportunities and wages throughout their careers. 1 2 3 4 5 6
Despite the importance of employer-sponsored training, little is currently known about how much Canadian employers invest in training, what kinds of training they offer, how it is delivered, what impacts it has, or how investment and opportunities differ across sectors, regions, and employee characteristics. Canadian data on the levels, kinds, trends, and impacts of employer-sponsored training are largely unreliable, out of date, and/or ill-suited for comparison across time and jurisdictions. Developing even a rough picture of the employer-sponsored training ecosystem in Canada relies on substantial bricolage and triangulation.
Still, examining the data that are available allows a grainy image to emerge. While far from the kind of clarity that is needed to fully understand the training ecosystem and design policies to spur improvements, some insights can be extracted. What seems apparent, as this report reveals, is that employer-sponsored training in Canada is limited, concentrated, oriented to immediate return on investment, and inequitably distributed. Specifically, employer-sponsored training is:
The sparse data also suggest that employers who offer training do so to meet competitive pressures, address skills shortages, and adapt to new technologies and regulatory changes. Those who fail to offer training, or provide it with difficulty, cite concerns about cost, time, availability of relevant training options, and poaching of upskilled employees by competitors.
This report draws on available literature and data to develop the best possible picture of employer-sponsored training levels and trends; types and modes of delivery; what motivates and hinders training investment; and how investment is distributed across sectors, types of firms, and learners. The report also assesses the data landscape, pointing out strengths, limitations, and gaps and identifying opportunities for better data collection to support understanding and policy-making. We know enough to see that improvements are needed, both in the training ecosystem itself and in the data available to understand how Canadian employers perform.
Key questions
We aimed to develop the best possible picture not only of aggregate training investment levels and trends, but also of how investment differs across sectors, employer types, and regions; what training types and modes of delivery are being used; what motivates and hinders investment; and how training opportunities are distributed among employees (e.g., by age, occupation, and educational attainment). Specifically, the research and report address the following key questions:
Additionally, the research and report answer key questions about the state of the available data, with a view to providing insight into what is needed to improve data collection to better understand the employer-sponsored training ecosystem. Specifically:
Approach
Given the absence of a comprehensive, reliable, longitudinal source or sources on employer-sponsored training and development in Canada, answering the key research questions required us to combine and analyze results from disparate sources, identify provincial and territorial data and literature that could fill gaps, and articulate the data and literature gaps that need to be filled in the future. Our approach involved:
Collecting and reviewing relevant literature and documents about training and development spending, activities, and performance in Canada, including reports, articles, academic literature, and relevant material collected from industry and business associations. This work largely took a national perspective, but includes literature with provincial/territorial and international lenses to fill some gaps.
Collecting and analyzing surveys and other data sources about training and development spending, activities, and performance. This includes data from Statistics Canada (including surveys on training and on other topics that include training-related questions, such as innovation and technology adoption), provincial statistical agencies, think tanks and industry associations, and international organizations.
Consulting with individuals in key organizations involved in collecting or analyzing training and development data—including statistical agencies, think tanks, industry associations, and academia—to better understand what is available and how data have been collected and analyzed.
A note on Canadian surveys covering employer-sponsored training
Understanding the employer-sponsored training ecosystem in Canada is an exercise in bricolage and triangulation. Data on employer-sponsored training emerge from multiple surveys that are not simultaneously up to date, comprehensive, reliable, and comparable over time and across jurisdictions. Each source focuses on slightly different aspects of training, and there are inconsistencies in how the sources pose questions and define training. For example, some surveys ask whether employers have provided or invested in training, while others ask about plans or intentions. Very few surveys elicit clear and reliable results about expenditures, hours of instruction, and kinds and modes of training. Even fewer provide insights into who receives training.
Surveys that provide clearer insights into employer-sponsored training have been discontinued (Statistics Canada’s Workplace and Employee Survey and Survey of Advanced Technology; the Conference Board of Canada’s Learning and Development Outlook) or are no longer current (including Statistics Canada’s Workplace and Employee Survey and the Organisation for Economic Co-operation and Development’s [OECD’s] Programme for the International Assessment of Adult Competencies). By contrast, the Business + Higher Education Roundtable and Business Council of Canada’s Skills Survey is up to date, but relies on a small sample size and is limited to the organizations’ members (primarily large employers), limiting the validity and reliability of its results. Other surveys are reliable and up to date, but focus only indirectly or imprecisely on employer-sponsored training (including Statistics Canada’s Survey of Innovation and Business Strategy, Survey on Quality of Employment, and Canadian Survey on Business Conditions).
A recent survey of employers and employees in Canada and the U.S. conducted by D2L and Innovative Research Group is a welcome contribution, given its rigorous and creative design and sample sizes (larger than those in recent think-tank surveys). Still, the survey’s framing and questions are unique and, as a result, not neatly comparable to other sources. Moreover, it focuses on small- and medium-sized firms, leaving out developments among large firms. In addition, it is unclear whether the survey will be fielded again to capture trends. Similarly, the Future Skills Centre (FSC), the Diversity Institute and the Environics Institute’s first Survey on Employment and Skills provides useful insights on employer-sponsored training from an employee perspective using a fairly robust sample size. However, the results are not neatly comparable to other sources, and subsequent waves of the survey have largely neglected employer-sponsored training.
There is an urgent need for better, more up-to-date data on employer-sponsored training in Canada to provide policy-makers, researchers, and employers with a strong understanding of patterns and trends and a good foundation on which to make policy and investment decisions.
The table below lists and analyzes the main data sources available in Canada, noting the date(s) collected, sample characteristics, training-relevant data provided, and limitations. A more comprehensive table appears in Appendix A and provides further details on survey designs, characteristics, and limitations.
A maple mishmash: The employer-sponsored training data landscape in Canada
| Workplace and Employee Survey (WES) (Statistics Canada) |
1999 to 2006 (discontinued) |
|
| Programme for the International Assessment of Adult Competencies (PIAAC) (OECD) |
2012 (first cycle); 2022 to 2023 (second cycle, pending) |
|
| Career Development in the Canadian Workplace: National Business Survey (CERIC) |
2013 (discontinued) |
|
| Survey of Advanced Technology (SAT) (Statistics Canada) |
2014 (discontinued) |
|
| Survey on Employment Training Practices in Québec (Institut de la statistique du Québec on behalf of the Commission des partenaires du marché du travail) |
2014 (status unknown) |
|
| Learning and Development Outlook (LDO) Survey (Conference Board of Canada) |
1993 to 2016 (discontinued) |
|
| Survey of Innovation and Business Strategy (SIBS) (Statistics Canada) |
2009 to present (ongoing, every 3 years; 2019 latest data) |
|
| Survey on Quality of Employment (SQE) (Statistics Canada) |
2021 |
|
| Survey on Employment and Skills (Future Skills Centre, Diversity Institute and Environics Institute) |
2020 to 2022 (4 iterations to date; ongoing) |
|
| D2L Employer-Supported Skills Development Survey (D2L and Innovative Research Group) |
2021 (future status unknown) |
|
| Canadian Survey on Business Conditions (CSBC) (Statistics Canada) | 2020 to present (ongoing, quarterly) |
|
| Skills Survey (Business + Higher Education Roundtable and Business Council of Canada) |
2014 to present (ongoing, every 2 years; 2022 latest data) |
|
Part II: Overview of employer-sponsored training: Types, modes, motivations
Canada’s skills and training ecosystem involves a wide range of organizations and activities. Employers and employer-sponsored training make up just one part.i Foundational skills and knowledge are acquired in K-12 education systems and, for some, learning continues in universities, colleges, polytechnics, and CEGEPs. Discipline-specific skills and some technical skills and knowledge are developed in post-secondary institutions and apprenticeship programs. Employers play key roles by offering supplementary training to new and ongoing employees; providing environments and opportunities for work-integrated learning for students and others;7 and serving as the sites of essential, though less measurable, experiential learning or “learning by doing.”8 This report focuses on the employer role and, specifically, the concept of employer-sponsored training.
What is employer-sponsored training?
Employer-sponsored training is any organized education or activities provided by an employer organization—whether public or private—to its employees and administered in a systematic and intentional way.9 Some employer-sponsored training lasts many months and leads to certification or credentials conferred by recognized educational or training institutions. In other cases, employer-sponsored training involves structured workshops, conferences, classes, occupational health and safety training, or structured orientation and onboarding activities focused on learning that do not necessarily result in certification or a credential, but nevertheless contribute to skills and knowledge. Apprenticeships are often considered a form of employer-sponsored training; however, due to their unique nature and narrow focus (primarily in skilled trades), this report treats them as distinct and focuses instead on all forms of employer-sponsored training that are not apprenticeships.
While employer-sponsored training is a broad concept, it is distinct from informal learning, which is largely unstructured and typically happens in the context of day-to-day activities on the job. Informal learning includes learning by doing, learning from others, and keeping up to date with products and services.10 While arguably as important as formal learning—especially for firm-specific innovation, productivity and performance—informal learning is difficult to measure and track.
Employer-sponsored training varies in content and mode of delivery.11 With respect to content, a further distinction between general and firm-specific skills training can be made. General skills training focuses on developing knowledge and skills that are more standardized and can be deployed by a worker across different employers (and sometimes across sectors). Firm-specific skills training focuses on developing knowledge and skills that are relevant only (or primarily) to the specific activities and technologies of specific employers, and therefore have little or no transferability.
In a perfectly competitive economy, a given employer may be reluctant to provide (or bear the full cost of) general skills training because of the increased chance that an employee may take these skills to a competitor. A competitor may even be able to outbid for the employee, having not paid for their skills development.12 As a result, theory suggests that employers should pay for firm-specific training only and not for general skills development. Firms may provide general skills training if employees accept a reduction in wages during the training period.13
However, the reality is more complicated. Employee movement between companies is not always seamless and is driven by many factors, including opportunities for advancement, different organizational cultures, location, business activities, colleagues, and many other reasons. As a result, many employers invest in general training despite the perceived risks, and see positive returns from doing so.14 15 16 Other evidence shows that employers tend to invest in training for employees who work in cognitively complex jobs, especially those that involve people management and interaction or that require the use of machinery or evolving digital technologies.17 18
Employer-sponsored training can also be distinguished by mode of delivery. The OECD (2021) outlines three primary ways in which employer-sponsored training can be administered:
In-person courses: These courses focus on a specific field or skill and are administered in either a classroom or workshop setting, typically by a professional from outside the organization. This category can include employers paying tuition and costs for employees to pursue training at external institutions, such as universities, colleges, and other training organizations.
Online training: This training often mirrors in-person course content, but is administered virtually over the internet. It can be in a lecture format, self-directed, interactive, or some combination of these.
On-the-job training: This type of training usually consists of time allocated for employees to learn specific skills to perform their day-to-day tasks and jobs. The distinction between formal, structured on-the-job training and informal on-the-job training is difficult to maintain. In practice, employer-sponsored, on-the-job training is generally signalled when employers intentionally allocate and record time and resources for more formal on-the-job training.
As we will discuss in greater detail later in the report, Canadian employers tend to provide on-the-job modes of training rather than classroom and other institutional arrangements.
Why do employers provide training opportunities?
A highly skilled workforce is an essential input into the innovation process and contributes to productivity, higher wages, and well-being. Some estimates suggest that more than half of the human capital developed during an individual’s lifetime can be attributed to post-school learning.19 20 Investments in training can lead to benefits for employers, such as enhanced productivity, better employee performance and retention, and adaptability to technological and regulatory changes. It can also benefit employees, contributing to higher satisfaction, better wages, and improved opportunities for advancement or employment change, especially when credentialled.21 22 23
Human capital is the stock of knowledge, skills, and personal characteristics that helps workers perform their roles more productively. It is developed through both formal education and training (both formal and informal).24 Generally speaking, investments in training can bridge the gap between the skills workers already possess and the skills a given firm requires them to have.25 Firms often invest in training to maintain or improve product quality, adapt to changing methods, consumer preferences, and standards, and pursue innovative activities, such as the adoption of new technologies—all of which can help improve productivity.26
Three studies using data from Statistics Canada’s Workplace and Employee Survey illustrate the return on investment in firm-sponsored training in terms of innovation and productivity:
Examining survey data from 1999 to 2006, one study showed that employer-sponsored training resulted in more product and process innovation. On-the-job training was found to be just as important as classroom training when it comes to innovation.27
Employees who received employer-sponsored classroom training (during the 1999 to 2006 study period) were 11 percent more productive than those who did not, which amounted to an additional $8,000 in value added per employee, on average. Employees who received on-the-job training were also more productive than those who did not, albeit by a smaller margin (of three to four percent).28
Investment in training had a positive impact on employee productivity in 12 of 14 industries (based on a sample of 3,528 firms studied from 1999 to 2005). While most industries saw improvements in productivity as a result of training, only four showed a positive return on investment: finance and insurance; forestry, mining, oil and gas; information and culture; and primary product manufacturing. In the finance and insurance industry, each additional dollar per employee spent on training increased labour productivity by more than $47. The remaining 10 sectors saw improvements in productivity, but not necessarily positive returns on investment.29
Many employers invest in employee training when they perceive gaps between employees’ existing skills and knowledge and what they need to perform effectively on the job.30 31 This comes in many forms. Orientation and onboarding for new employees is routine for employers who understand that workplace readiness is not something that can be taught in a classroom because every organization has its own practices and culture. Training is also provided by employers who recognize changes in the nature of tasks and the need to have employees upskill to continue to perform effectively, as well as by employers who understand that some employees will need additional skills to perform jobs vacated when experienced staff retire.
According to the 2019 Survey of Innovation and Business Strategy, 56 percent of companies across Canada reported training their staff to overcome specific skills shortages. This was even higher among retail firms (61 percent), construction firms (62 percent), and firms in finance and insurance, administration and support, waste management, and remediation services (65 percent).
Technological change is an ongoing reality. Firms that want to maintain their competitiveness invest both in new technologies and in improving employees’ skills to ensure they can effectively use and operate new technologies. Data from the Workplace and Employee Survey confirm that Canadian employers that adopt new technologies are more likely to invest in training than those who do not.32 Data from the 2014 Survey of Advanced Technology reveal that 22 percent of firms provided training related to the adoption of new technologies. This figure rose to 30 percent in manufacturing and 36 percent in utilities.
In some cases, employers invest in technology-related training for their employees even if they do not expect a positive financial return because they recognize that maintaining operations and competitiveness is imperative enough.33 Moreover, employers provide training not only to help employees adopt and use new technologies (e.g., digital and technical skills), but also to enhance skills to perform tasks that are better performed by people than by technology (e.g., social and communications skills, problem-solving, and critical thinking).34 In that sense, technological change prompts both technical and non-technical training.
Regulation also drives firms to invest in training. In some cases, a regulatory change explicitly requires employers to offer training, including specific kinds of training. The Accessibility for Ontarians with Disabilities Act requires employees of firms over a certain size to undergo training to meet the act’s requirements; similar requirements can be found in various provincial occupational health and safety acts. In other cases, regulations include a requirement to train generally, but leave the content up to employers (e.g., Québec’s Law 90 requires firms with payrolls over $2 million to spend at least one percent on training or forfeit the difference between their actual expenditures and that benchmark to a workforce development fund). Finally, some regulatory changes do not explicitly require employers to offer training, but employers might choose to train as a strategy to meet requirements.
The OECD conducted a qualitative study of employer-sponsored training offered by 100 firms in five countries (Austria, Estonia, France, Ireland, and Italy). It revealed that almost half of the firms interviewed provided training to comply with legal requirements.35
In addition to the productivity and adaptability benefits that employer-sponsored training can generate, employers’ training investments can improve employees’ satisfaction and likelihood of staying with the firm. While Canadian data are difficult to find, training has been shown in other jurisdictions to improve organizational commitment and reduce employee turnover because employees feel more supported in a job that invests in their skills development.36
Moreover, upskilling can enhance employee wages when firms that are more productive and profitable share the gains with employees. While studies generally show that the productivity benefits exceed the wage benefits of training, employees still benefit.37 38 A meta-analysis of 71 studies conducted between 1981 and 2010 found that a one percent increase in training expenditures increased wages by 2.6 percent.39
What prevents employers from providing training opportunities?
Employers and employees cite a number of barriers to sponsoring or engaging in training, including cost, time, access to expertise, fear of poaching, and concerns about return on investment. While some of the perceived barriers may rest on inaccurate assumptions, many employers or employees believe them to be real; as such, they appear to shape decision-making and behaviour.
Many employers recognize the value of providing training to their employees, but the initial cost of training can be prohibitive.40 Even if training improves productivity, the magnitude of the impact does not always justify the expense. One Canadian study using data from the Workplace and Employee Survey found that while most industries experienced improved productivity as a result of training, only four industries41 had a positive return on their investment.42
There are also concerns about poaching, specifically that employers’ investments in skills development might make their employees more attractive to competitors, prompting them to change companies instead of applying their new skills and knowledge in their current workplaces.43 In the D2L survey, for example, 28 percent of small- and medium-sized enterprises said an important barrier to training investment is a fear that “employees will take their new knowledge to other organizations.” Thirty-one percent said that “recruiting employees from other firms is easier than training existing employees,” which suggests that poaching is a reality about which employers might reasonably be concerned.44 Similarly, in the 2013 Career Development in the Canadian Workplace survey from CERIC, 25 percent of employers said that losing employees after investing in their training was a great concern, and another 39 percent said it was at least somewhat of a concern.45
Disentangling the fear of poaching from the reality of it is difficult. The D2L survey finds that, despite fears of poaching, half of employers provide internal training opportunities and more than a third provide support for externally provided training. This suggests that the fear of poaching is neither universal nor determinate employer behaviour.46
Time is another major constraint for employers. In 2010, Employment and Social Development Canada, in partnership with the Social Research and Demonstration Corporation, undertook an evaluation of a literacy and essential skills program. Although the program had positive impacts in terms of productivity and return on investment, employers released employees for just under 20 hours per participant, on average—less than half of the 40 hours of training the program offered. Losing employees to training for too long in the face of business and operational demands was identified as a major constraint for employers in allowing employees to engage in training.47
In addition to cost and time constraints, knowledge and expertise can act as barriers in two ways. In the first place, employers may lack the information they need (and the ability to interpret the information that is available) to make good decisions about what skills they need now and will need in the future—and, therefore, where they should invest their training dollars. In the second place, even when employers can identify what they need and where they want to invest, many lack the appropriate processes and personnel to implement adequate training programs, as well as a sufficient understanding of local training providers and the services they offer.48 49
While employers face barriers to offering training, employees face barriers to pursuing training, even when opportunities are offered. Because track records on employee uptake might shape employers’ future decisions about how much to invest, it is important to understand why some employees do not pursue training.
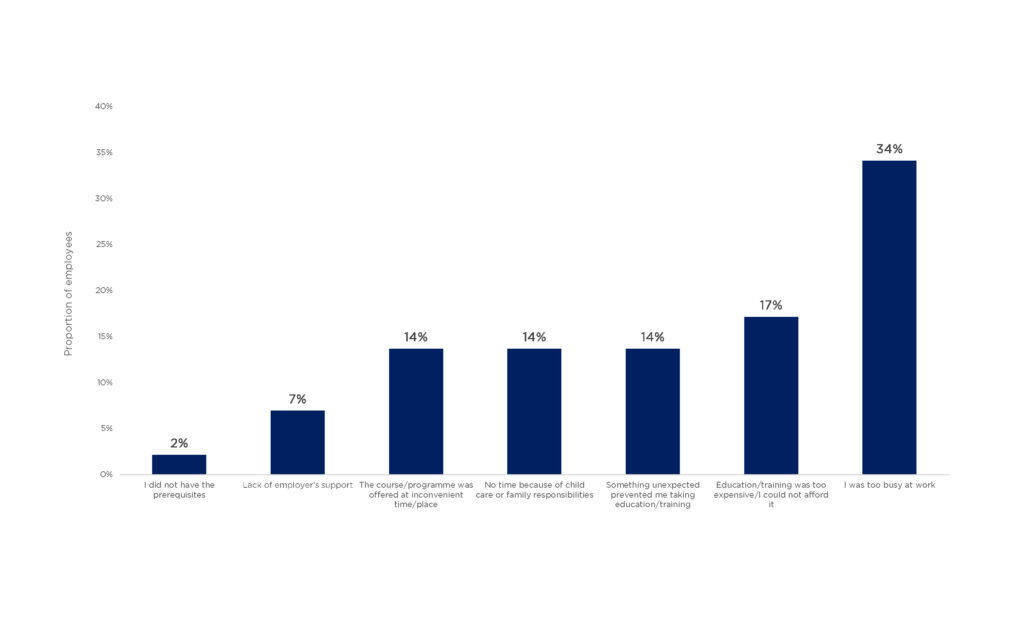
Data from the OECD’s 2012 Programme for the International Assessment of Adult Competencies (PIAAC) provide insight into the barriers to training from an employee perspective. Time is a major constraint: 34 percent of respondents said that they were too busy at work to participate in training. This suggests that even when employers invest in training, they need to think about work-release for employees to pursue it. Another 17 percent of employees stated that training was too expensive, yet only seven percent cited a lack of employer support. This could suggest that employers may be paying for only a part of the training, with employees expected to cover the rest. Other barriers relate to personal circumstances, such as an unexpected life event or family responsibilities.
Figure 1: Time is the largest barrier for employees to participate in training
Reasons preventing employees from participating in education and training, 2012
Source: Programme for the International Assessment of Adult Competencies (PIAAC)
Sample size: ~5,000 adults
Part III: Canada’s performance on employer-sponsored training
The reasons for employers to invest in employee training are clear. Employer investment in employee training can improve innovation, productivity and competitiveness; enhance employees’ ability to adapt to technological and regulatory change; address skills gaps; and strengthen relationships with talented employees. Yet many employers face barriers to providing training opportunities to new and current staff, while others are unconvinced that the benefits justify the costs. In this context, how well is Canada’s employer-sponsored training ecosystem faring? How much is invested, by which employers, in which sectors, and for what purposes? Which employees are offered training opportunities and which are neglected? What kinds of training are most often offered and through what delivery modes? And how are employers’ decisions affected by policies, incentives, and circumstances?
In this part, we examine what is known—and not known—about Canada’s employer-sponsored training performance. Based on the analysis of available data, there is room for improvement. Too few employers invest in training, especially smaller employers and those in certain sectors. Employees with higher levels of education and those in management and professional roles tend to receive a disproportionate share of training opportunities.
How much is spent on employer-sponsored training?
Key points
Using available data, it is possible to generate a picture of employer investment in training, but the picture is imprecise and largely out of date. The most accurate data come from Statistics Canada’s Workplace and Employee Survey (WES), which was discontinued in 2006. More recent data can be found in surveys by independent research institutions, but these tend to be based on very small sample sizes, skewed to employers more likely to report investment than the economy-wide average, and unsuited for comparisons over time. Recognizing these limitations, it is possible to piece together existing data to provide some insights into Canadian employers’ training investments.
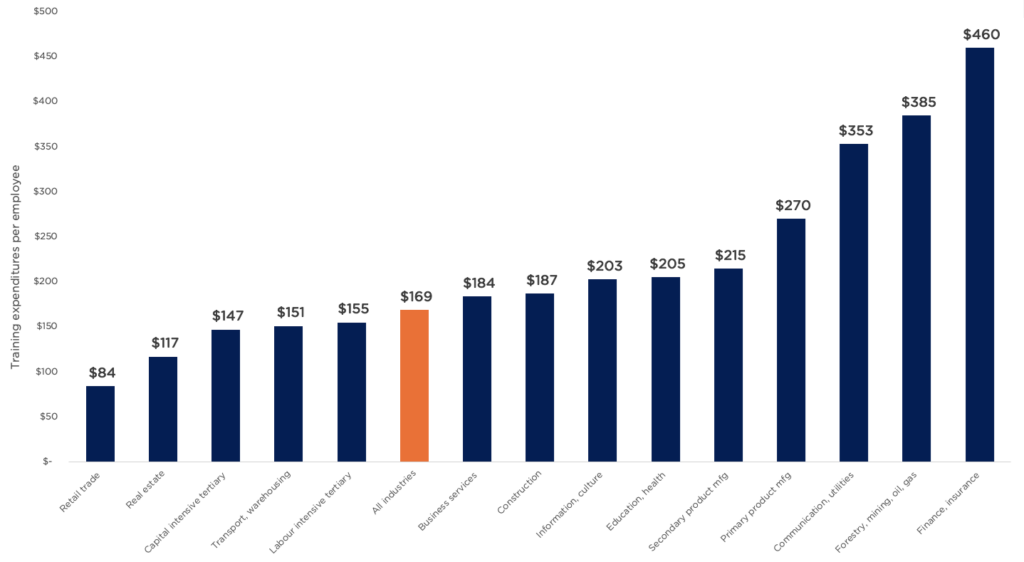
Percival, Cozzarin, & Formaneckl (2013) examined training expenditures per employee across different industries using the Workplace and Employee Survey. They found that, in 2005, Canadian firms spent an average of $169 per employee per year on training. Spending was higher in certain sectors, including finance and insurance ($460), resource extractive industries ($385), and communications and utilities ($353). Adjusted for just inflation, firms across the economy invested just over $240 per employee in 2022 dollars. Firms in finance and insurance industries invested nearly $655 per employee in 2022 dollars; firms in resource extractive industries invested just over $550 per employee; and communications and utilities firms invested nearly $505 per employee.
Figure 2: Finance and insurance lead the way in investments in training
Training expenditures ($ per employee), 2005
Source: Percival, Cozzarin, & Formaneckl (2013) using the WES
Sample: ~6,000 employers, ~24,000 employees
Other surveys offer more up-to-date estimates, but are based on small and skewed samples of employers; therefore, they are unsuitable for generalizing across the economy. The Conference Board’s discontinued Learning and Development Outlook survey showed that, on average, surveyed Canadian employers spent $889 per employee in 2016–2017—an increase of $89 per employee over the previous survey cycle (2014–2015).
Figure 3: Employer expenditures on training appear to be declining
Direct learning expenditure per employee, 1993-2016

Source: Conference Board of Canada 2018
Sample: 100 to 200 employers
Despite the increase, Canadian firms continued to lag American firms, spending just 81 centsii for every dollar spent by firms in the United States. . While this is an improvement from 57 cents in 2006, the gap narrowed mainly because U.S. firms decreased their spending, not because Canadian firms increased theirs.
Canada’s apparent poor performance relative to the U.S. generally may be a function of structural differences in the two economies. In 2020, 68 percent of individuals in the private sector in Canada worked for small businesses (one to 99 employees) while just 34 percent in the United States worked for small businesses.50 51 Given that smaller firms are less likely to invest in training (as discussed later in the report), Canada’s higher proportion of employment in small firms may explain some of the difference. However, at the moment, the data are insufficient to test this hypothesis. Between-country comparisons would benefit from controlling for firm size.
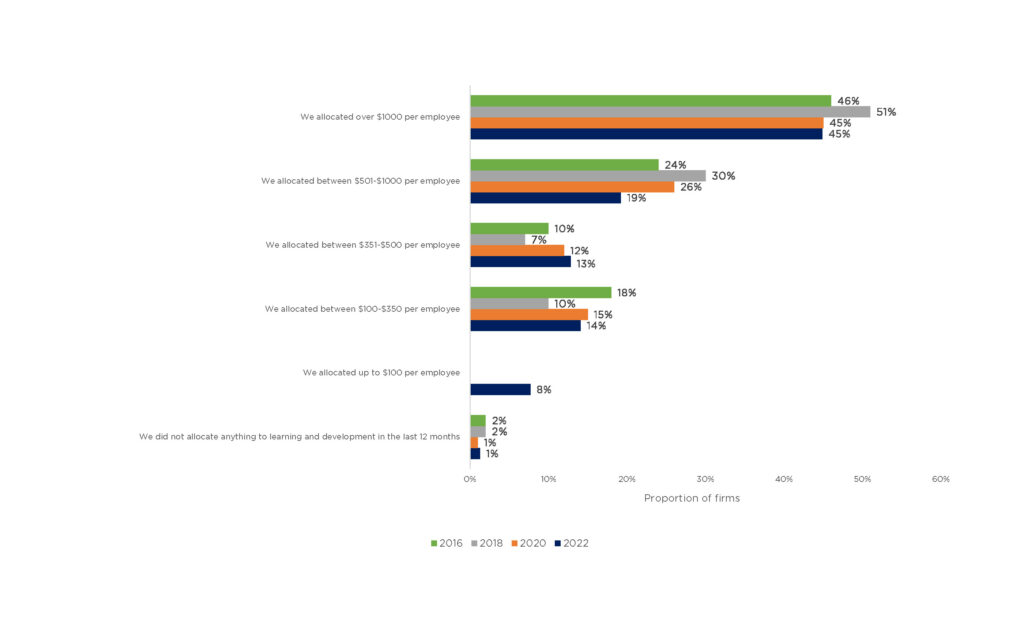
In the Business Council of Canada and BHER 2022 Skills Survey, 45 percent of surveyed employers reported spending more than $1,000 per employee on training in the past 12 months—down from 51 percent in the 2018 survey, but consistent with earlier years. Just fewer than 20 percent reported spending $500 to $1,000 per employee on training—down nearly seven percentage points from 2020 and 10 percentage points from 2018. However, like the Conference Board survey, this one is skewed toward larger employers (who tend to be more likely to invest in training); therefore, it likely overestimates the amount average employers across Canada invest in training.
Figure 4: Nearly half of firms surveyed allocated more than $1,000 per employee on training
Expenditures on learning and development in the last 12 months in Canada, BCC + BHER, 2022
Source: BCC and BHER Skills Survey
Sample: 95 employers
The Canadian Survey on Business Conditions helps paint a picture of some of the challenges businesses faced in terms of training during the pandemic. It might help to explain the dip in spending recorded in the BCC + BHER Skills Survey. Businesses were asked to what extent they would find it challenging to find time and resources to train current and new staff.
Current staff. In the early phase of the pandemic (second quarter of 2020), 31 percent of businesses said it was either somewhat or very challenging to train current staff. By the second quarter of 2021, this figure had increased to 37 percent.
New staff. A slightly higher proportion of businesses experienced challenges training new staff. In the second quarter of 2020, 33 percent said they had faced challenges. This figure increased to 38 percent in the second quarter of 2021.
Figure 5: Businesses express difficulties finding resources to train staff
Businesses expect at least some difficulties finding time and resources for training staff over the next three months

Source: Canadian Survey on Business Conditions
Sample: 16,000 + businesses
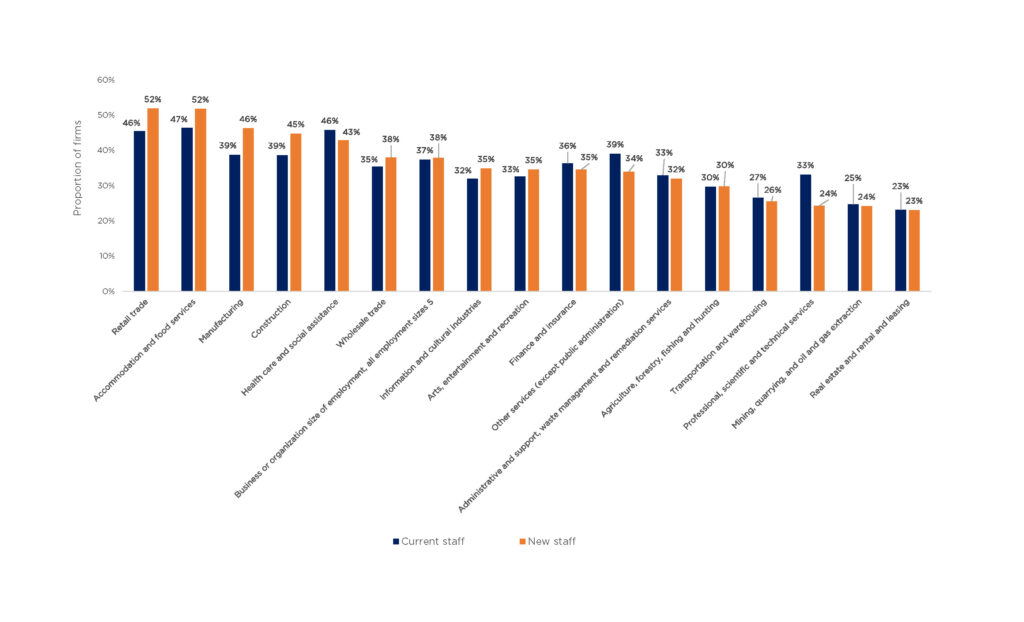
Looking at data disaggregated by industry, firms in the industries most severely impacted by the pandemic—that is, retail trade, accommodation and food services, health care, social assistance, and manufacturing—were more likely to report resource-related challenges to train new or current employees. While the impacts of the pandemic varied considerably from sector to sector, employers who experienced expansion and contraction of their workforce were more likely to need to invest in training; at the same time, they faced higher costs and fewer resources to do so. Many employers also needed to train current employees to adopt new infrastructure, tools, and techniques to deal with the frequently changing conditions of the pandemic.
Figure 6: Businesses in the industries most impacted by pandemic express difficulties training staff
Businesses that expect difficulties finding time and resources for training staff over the next three months, second quarter 2021
Source: Canadian Survey on Business Conditions
Sample: 16,000+ businesses
Pandemic or not, Canadian employers appear to spend limited amounts on employee training. While industry surveys such as those conducted by the Business Council of Canada and the Conference Board of Canada indicate higher levels of spending, these are likely due to survey designs that over-represent employers who are already interested and engaged in training issues and activities. To get a clear understanding of spending levels and trends across the economy will require a more robust, regular, and large-sample survey of Canadian employers. At the moment, employer-sponsored training researchers are largely in the dark on expenditures.
Which employers sponsor training?
Key points
Employer spending on training varies by firm size, sector, and region. This is to be expected, given that different firms have varying levels of resources available to them and sectors face different economic circumstances. But what are the differences, exactly? As with other training-related questions, the data are sparse, dated, and of limited reliability. However, some insights can be extracted.
Investing in training requires financial resources, time, and capacity to identify needs, coordinate opportunities, and deliver and pay for instruction. If training is offered internally, firms also require the skills, expertise, and resources to coordinate and implement training. As a result, training is more likely to take place among larger firms with more capacity. When smaller firms invest in training, they often choose modes of training that help address the capacity challenges.52 Overall patterns and trends in training investment in Canada are very likely shaped by the fact that a disproportionately large number of Canadians are employed in small firms that tend to invest less, and differently, than larger firms.53 54
According to the 2014 Survey of Advanced Technology, 22 percent of Canadian businesses of all sizes offered training to their employees related to the adoption of advanced technologies. However, disaggregated by size, the survey data showed that while only 21 percent of small businesses offered training to support the adoption of advanced technologies, 28 percent of medium-sized businesses and 39 percent of large businesses offered such training. Due to the high proportion of small businesses in the Canadian economy generally, the overall training rate of 22 percent is closer to the small firm training rate of 21 percent. (In 2020, 98 percent of Canadian businesses had fewer than 100 employees.)55
Figure 7: Training increases with firm size
Employees received special or new training related to the adoption of advanced technologies, 2014

Source: Survey of Advanced Technology
Sample: 11,887 businesses
While the Survey of Advanced Technology provides insight into training only as it pertains to technology adoption (a subset of all possible training-related activities), other surveys with broader framing on training reveal similar patterns. For example, the 2019 Survey of Innovation and Business Strategy found that while 78 percent of all surveyed businesses had provided job-specific training to employees, provision varied by firm size, with small firms (76 percent) providing training at lower rates than medium firms (85 percent) and large firms (86 percent). Breaking down the trends by type of training, the survey showed that while 59 percent of large businesses and 46 percent of medium-sized firms offered managerial training to employees, only 28 percent of small businesses offered this kind of training. Similar trends can be seen with training in new technology, training in new business practices, and digital skills training.
Figure 8: Training increases with firm size
Training or development activities arranged or provided by the business to employees, 2019

Source: Survey of Innovation and Business Strategy
Sample: 14,985 businesses for 2019 release
Firm-size discrepancies in training investment are confirmed by the more recent Canada Survey on Business Conditions. Asking about training intentions rather than past activities, the CSBC found that while 17 percent of all surveyed businesses said they intended to provide training to current employees in the next 12 months, the intentions were as low as 13 percent among firms with one to four employees and as high as 35 percent among firms with 100 or more employees.
Figure 9: Plans to provide training increased with firm size
Provide training to current employees in a different skill set in the next 12 months, second quarter 2021

Source: Canadian Survey on Business Conditions
Sample: 16,000 + businesses
Finally, when we look at data about training collected from employees (rather than employers) we see a steep gradient in training participation by firm size. The OECD’s PIAAC data show that while 30 percent of Canadian respondents who work in firms with one to 10 employees said they received on-the-job training, the proportion more than doubled (to 62 percent) among employees of firms with more than 1,000 people.
Figure 10: People working in larger firms more likely to participate in training
Participation in employer-sponsored on-the-job training in the past 12 months, 2012

Source: Programme for the International Assessment of Adult Competencies (PIAAC)
Sample size: ~5,000 adults
If firm size provides one useful lens for understanding differences in support for employer-sponsored training, sector type provides another. Whereas with firm size, larger firms appear to offer more training due to greater resources and capacity, certain sectors appear to support more training than others due to varying economic circumstances and the technology-intensity of their activities. Of course, differences in firm sizes from sector to sector may also play a role in a sector’s overall propensity to train.
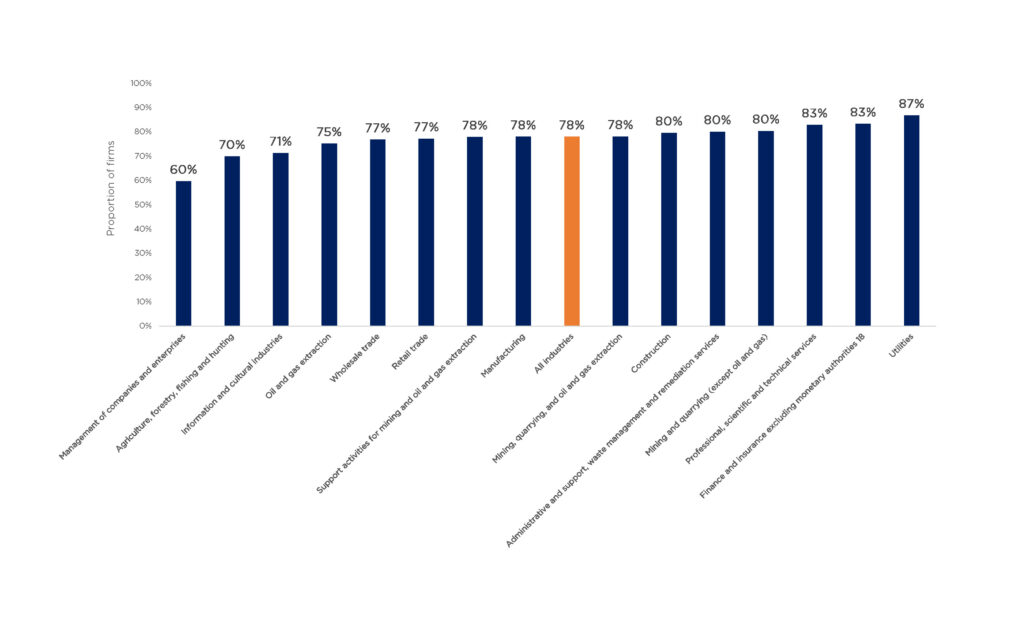
The 2019 Survey of Innovation and Business Strategy (SIBS) finds that businesses in the utilities (87 percent), finance and insurance (83 percent), and professional, scientific, and technical industries (83 percent) are more likely than other sectors to provide job-specific training to employees. The high instance of training in the utilities sector may be driven at least partially by increasing pressure to meet regulatory and consumer demands related to climate change and sustainability, as well as by occupational health and safety requirements prescribed by various federal and provincial laws.56 57 58 59 60 Firms in agriculture, forestry, fishing and hunting (70 percent), information and cultural industries (71 percent), and oil and gas extraction (75 percent) were less likely to report providing job-specific training. It is worth noting that most firms in all sectors in the SIBS data reported providing training, and that the differences among most sectors are significant but not especially large.
Figure 11: Utilities and finance industries most likely to provide job-specific training
Job-specific training arranged or provided by the business to employees, 2019
Source: Survey of Innovation and Business Strategy
Sample: 14,985 businesses for 2019 release
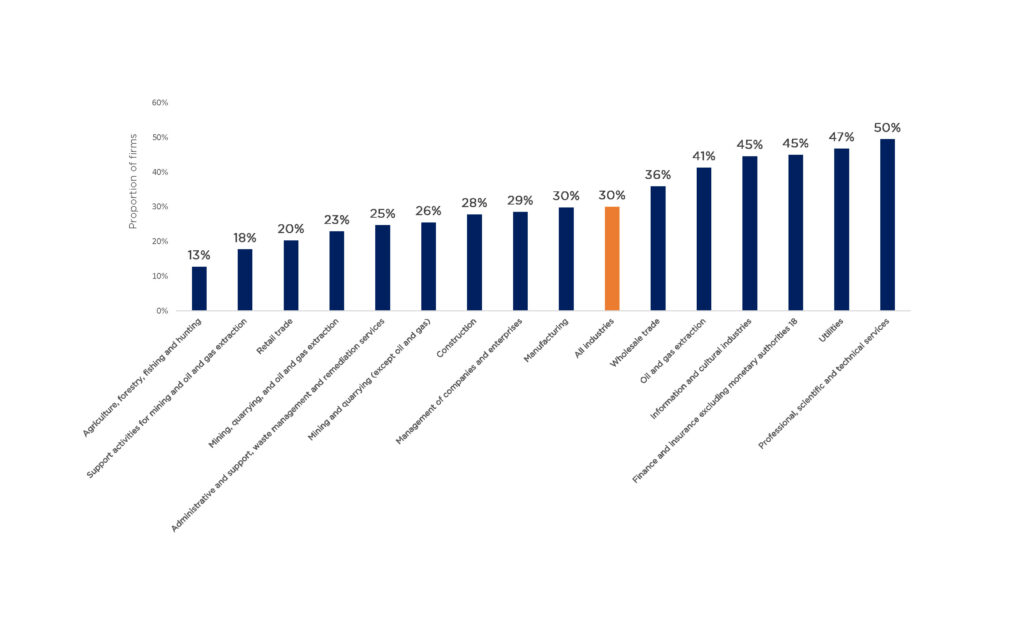
Looking at training investments related to the adoption of new technologies, the SIBS data reveal even sharper differences. While 30 percent of firms in all sectors reported providing training to employees to integrate and use new technologies, firms in professional, scientific, and technical services (50 percent), utilities (47 percent), and finance and insurance (45 percent) provided training at much higher rates than retail trade (20 percent), support activities for mining and oil and gas extraction (18 percent), and agriculture, forestry, fishing and hunting (13 percent).
This suggests that training in utilities, finance and insurance, and professional, scientific, and technical industries is partially related to the pace of technology adoption in these industries. According to a 2019 study from the Brookfield Institute for Innovation + Entrepreneurship, utilities; professional, scientific, and technical industries; and finance and insurance industries have some of the highest concentrations of technology workers in the economy (including digital jobs whose primary output is digital products and other high-tech jobs that make use of digital products).61 The 2014 Survey of Advanced Technology provides additional evidence to support this. According to the survey, 36 percent of businesses in utilities provided support for training to facilitate the adoption of advanced technologies, compared to 22 percent across the economy, the highest proportion of any industry. At 25 percent, businesses in professional, scientific, and technical services were also more likely to provide training related to advanced technology compared to the rest of the economy.
Figure 12: Utilities finance and other knowledge-based industries leaders in training for new technology
Training in new technology, arranged or provided by business to employees, 2019
Source: Survey of Innovation and Business Strategy
Sample: 14,985 businesses for 2019 release
There are some limited data showing that employees are more likely to receive training if they are employed by public or non-profit organizations. Among participants in the OECD’s PIAAC survey, 60 percent of those employed in the public sector said they attended organized on-the-job training sessions versus 47 percent among non-profit employees and 37 percent of those employed in the private sector. There are at least two possible, non-exclusive, explanations. First, public sector organizations tend to be larger than private sector organizations; the difference may be in part simply a reflection of organization size rather than public versus private sector per se.62 Second, unionization in the public sector tends to be higher than in the private sector, and there is some evidence that unionized employees are more likely to receive training than non-unionized employees.63 Still, there is limited data to allow for a careful assessment of the validity of each hypothesis in explaining these differences.
On the surface, there appear to be regional differences in employer-sponsored training across Canada, although these may have more to do with differences in industrial composition than with regional culture or policy. Firms in Québec and Ontario are more likely than firms in other parts of Canada, especially firms in the Atlantic provinces, to report providing job-specific training to their employees, according to the 2019 Survey of Innovation and Business Strategy. While 80 percent of Québec firms and 79 percent of Ontario firms in the survey reported offering job-specific training, only 69 percent of firms in the Atlantic provinces did so.
Ontario and Québec have more firms (both absolutely and proportionally) in industries that are more likely to engage in training—namely, utilities, finance and insurance, and professional, scientific, and technical services. Québec and Ontario together made up 61 percent of total Canadian employment in utilities in June 2022; 70 percent of national employment in finance and insurance; and 66 percent of national employment in professional, scientific, and technical services.64 Québec’s training levy law—which requires firms with payrolls of $2 million or more to invest in training—may also play a role. We examine Québec’s training levy and its impact in later sections of the report.
Figure 13: Quebec and Ontario businesses more likely to provide job-specific training
Job-specific training arranged or provided by employers, 2019

Source: Survey of Innovation and Business Strategy
Sample: 14,985 businesses for 2019 release
The COVID-19 pandemic appears to have spurred some sectors to invest more, or at least plan to invest more, in training versus their pre-pandemic baselines. Some of these sectors—manufacturing, wholesale trade, accommodations, and food services—were hit particularly hard by the pandemic; the spike in training activity and intentions may reflect strategies to adjust to abnormally high staff turnover, increased adoption and use of technologies, and/or changes in business practices.65 66 67
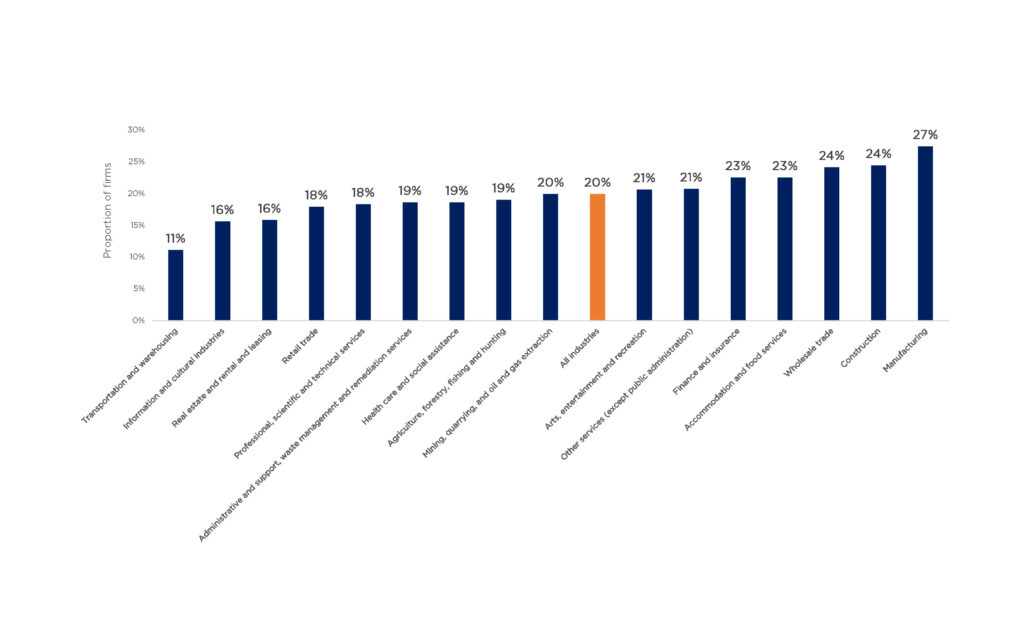
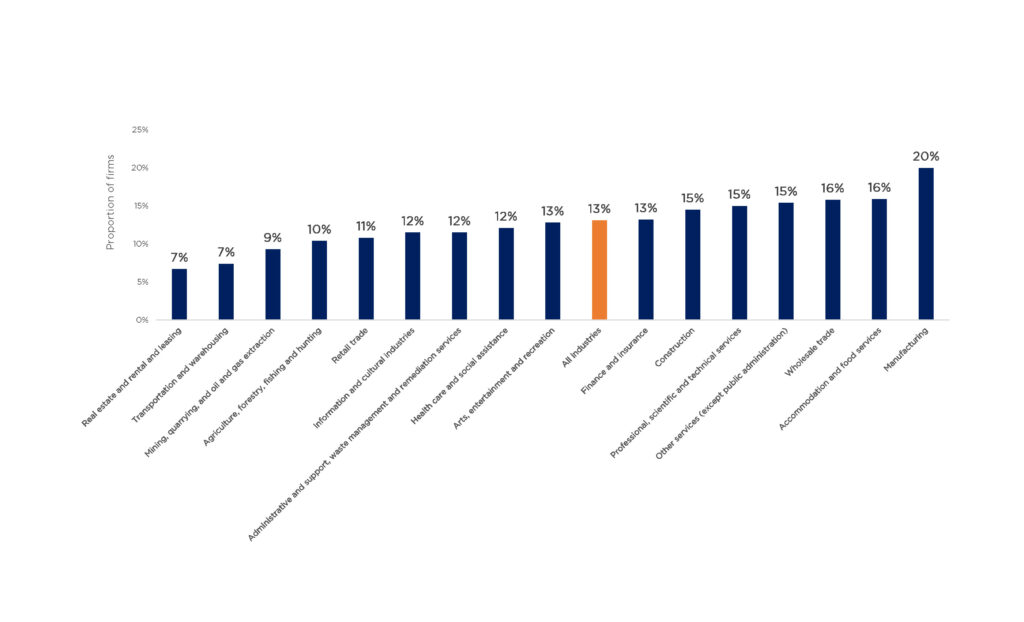
The Canada Survey on Business Conditions asked about training intentions during the pandemic. When examining the most common modes of training, the results showed that businesses in manufacturing were more likely than others to say they plan to encourage employees to participate in on-the-job training over the next 12 months (27 percent versus an all-industry average of 20 percent), and more likely to train employees over the next 12 months to take on new roles in the organization (20 percent versus an all-industry average of 13 percent). Nearly one-quarter of businesses in construction and wholesale trade said they plan to encourage employees to participate in on-the-job training over the next 12 months. Businesses in wholesale trade (16 percent) and accommodations and food services (16 percent) were also more likely than firms in all industries (13 percent) to say they plan to provide training to employees over the next 12 months to take on new roles in the organization.
A previous survey found that in many sectors where training activity appears to have increased during the pandemic—manufacturing, accommodations, and food services—employers also reported experiencing challenges finding the resources to train new and current staff. In these sectors, employers may be struggling to keep up with planned training activities. These employers may also be providing less training to their employees than they otherwise would if they had the resources.
However, not every sector that was severely affected by the pandemic appears to have adopted more intensive training plans and activities. Retail businesses (11 percent) were a little less likely than firms in all industries (13 percent) to report plans to provide training to employees to take on new roles in the organization. Many retail businesses also indicated significant resource-related challenges related to training, but unlike some of the aforementioned sectors, they appear to have been unable to overcome these constraints.
Figure 14: Manufacturing most likely to encourage on-the-job training in the first quarter 2022
Encourage employees to participate in on-the-job training over the next 12 months, first quarter 2022
Source: Canadian Survey on Business Conditions
Sample: 16,000 + businesses
Figure 15: Manufacturing most likely to provide training for internal career opportunities in the first quarter 2022
Provide training to employees to take other positions within this business or organization over the next 12 months, first quarter 2022
Source: Canadian Survey on Business Conditions
Sample: 16,000 + businesses
Figure 16: Certain knowledge-based industries were more likely to provide paid time off to engage in learning and development opportunities
Provide employees with paid time to engage in learning and development programs over the next 12 months, first quarter 2022
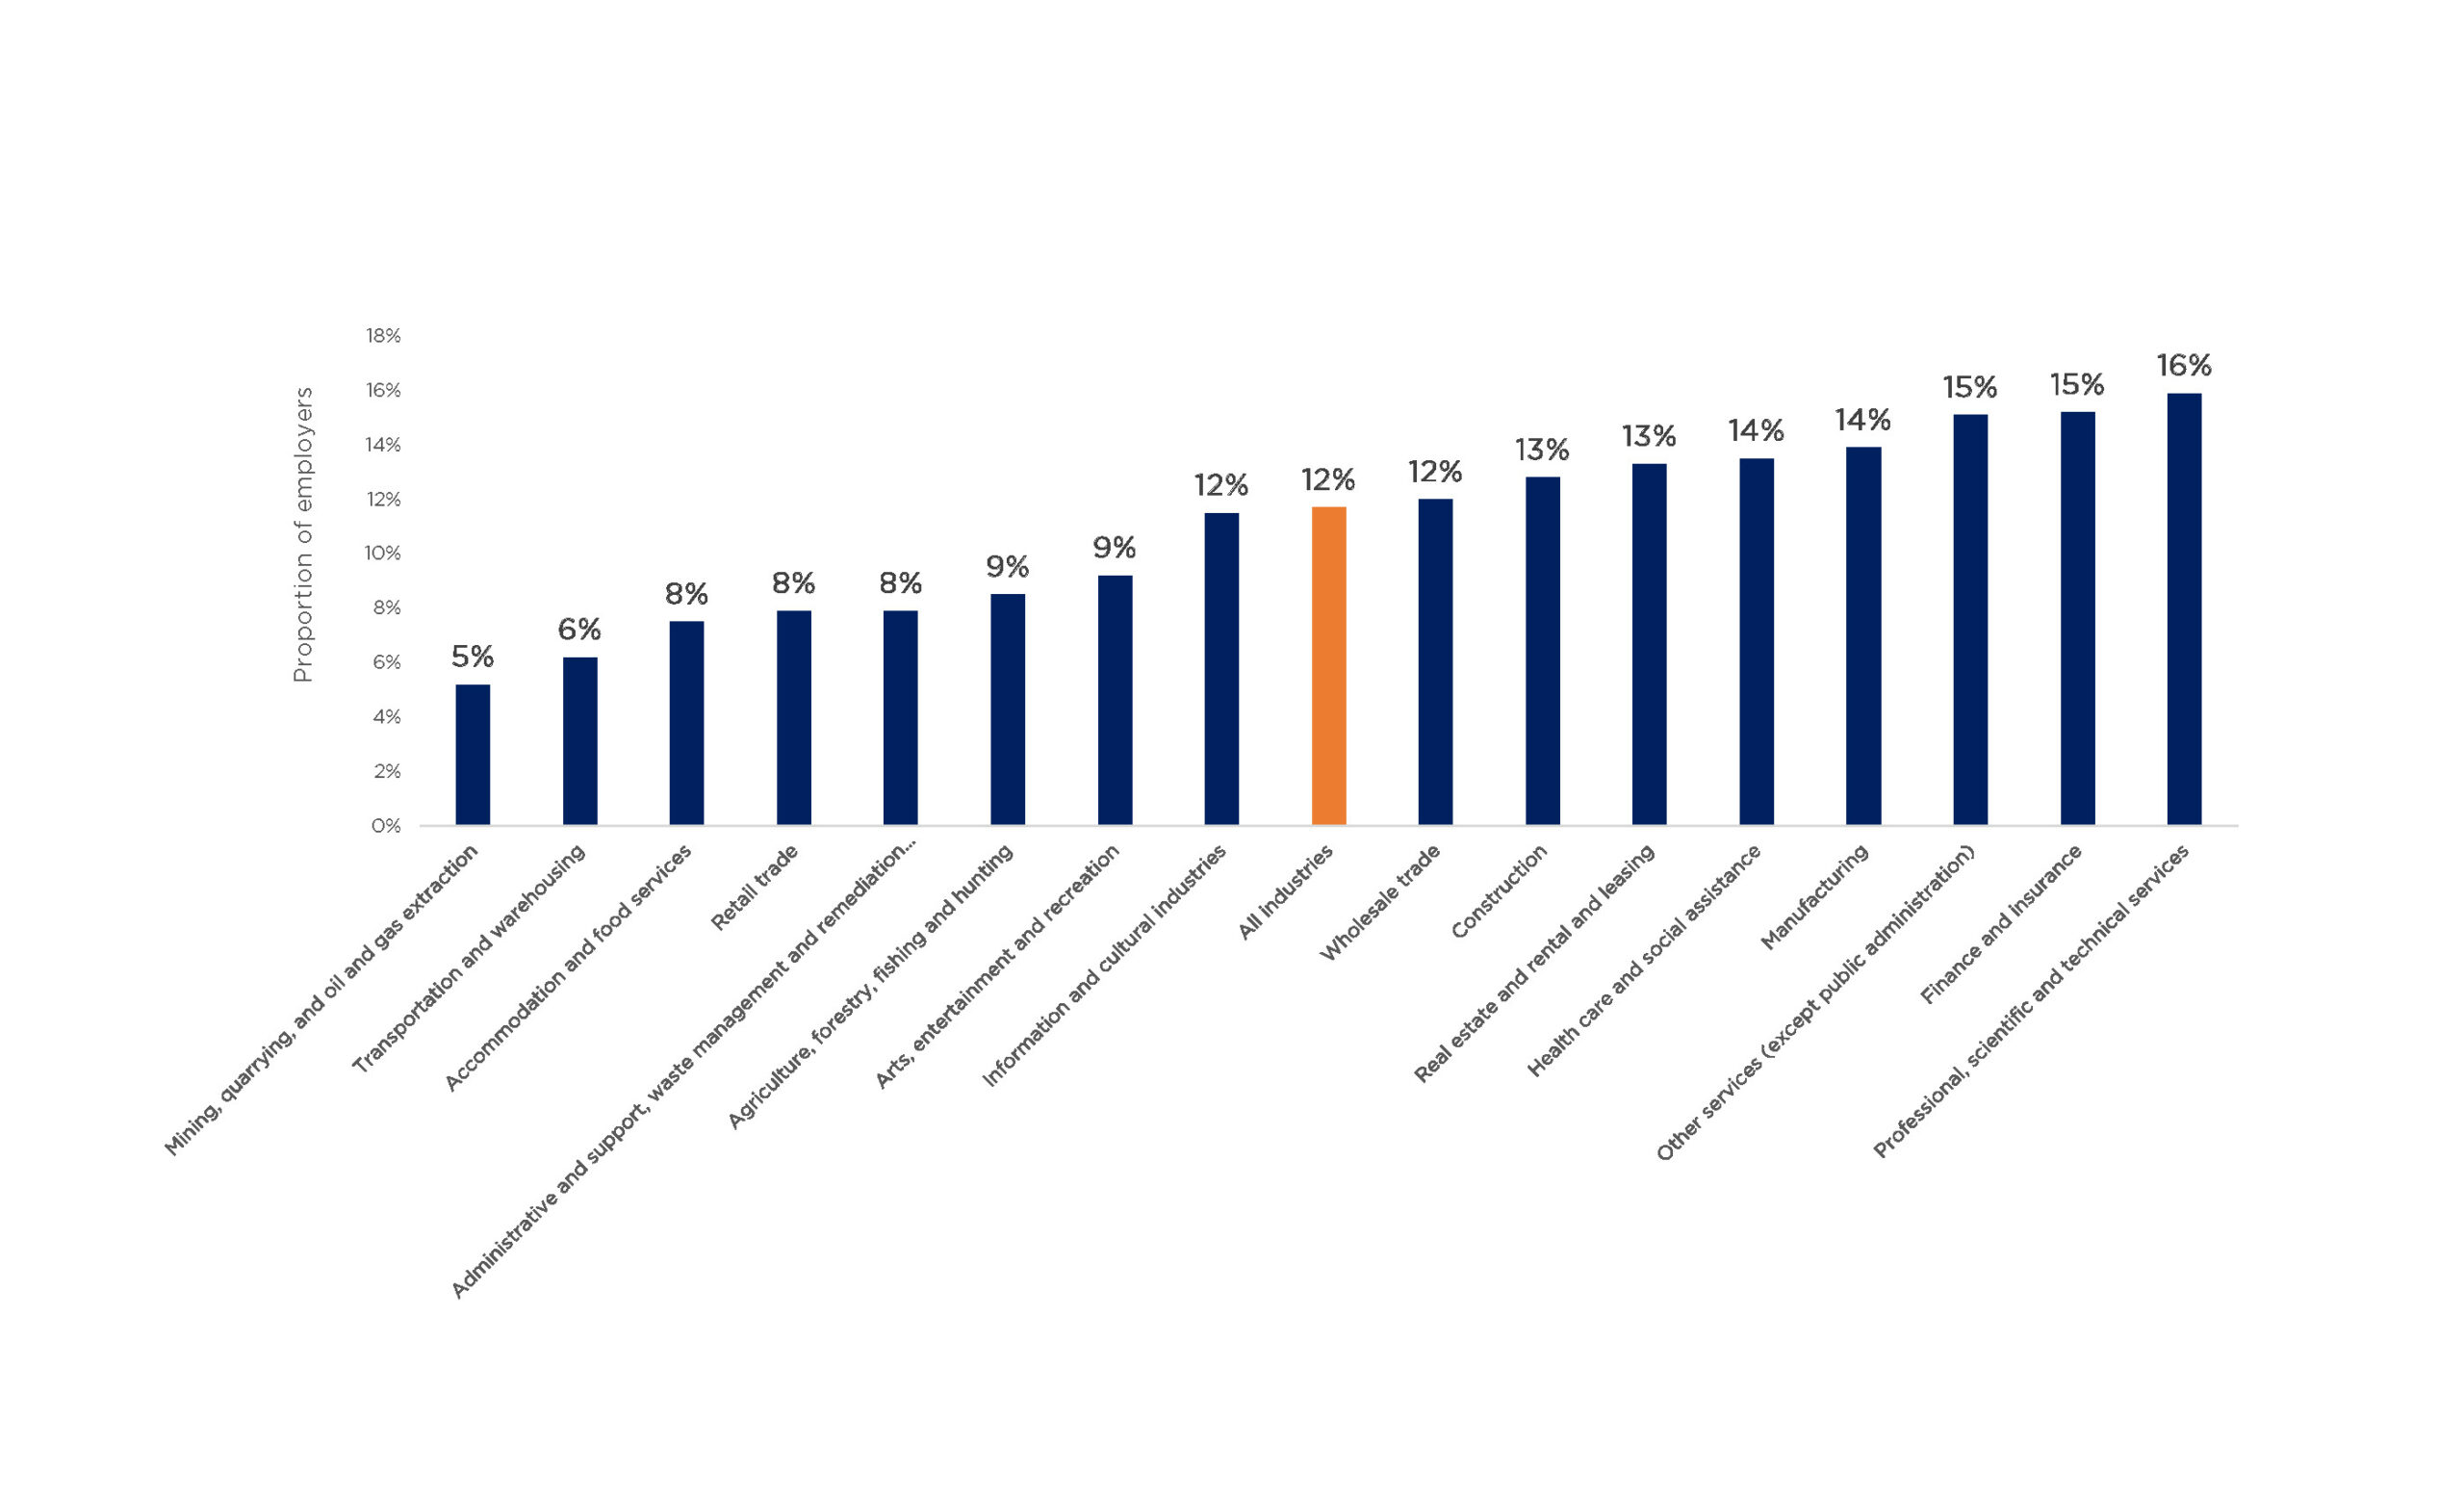
Source: Canadian Survey on Business Conditions
Sample: 16,000 + businesses
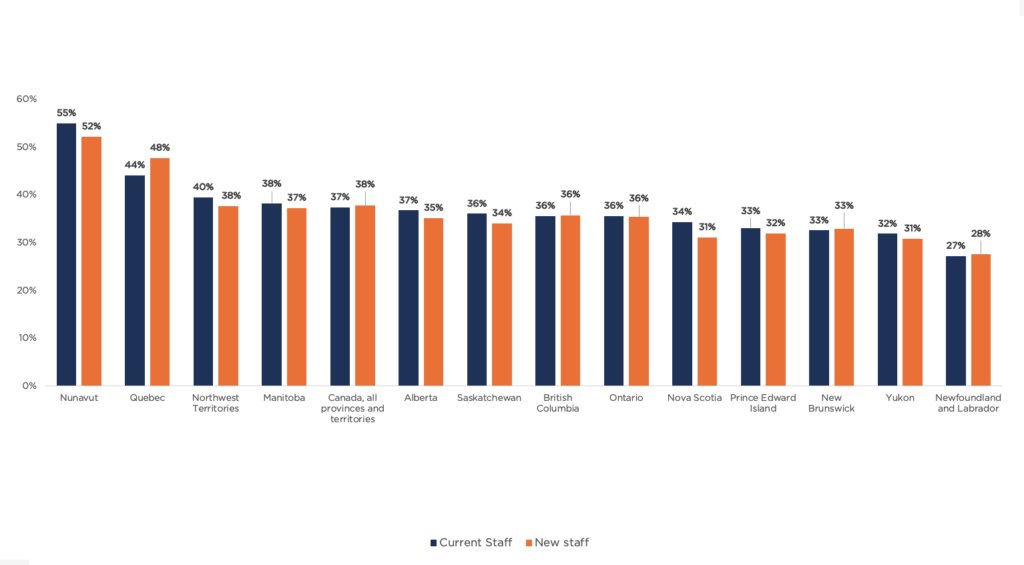
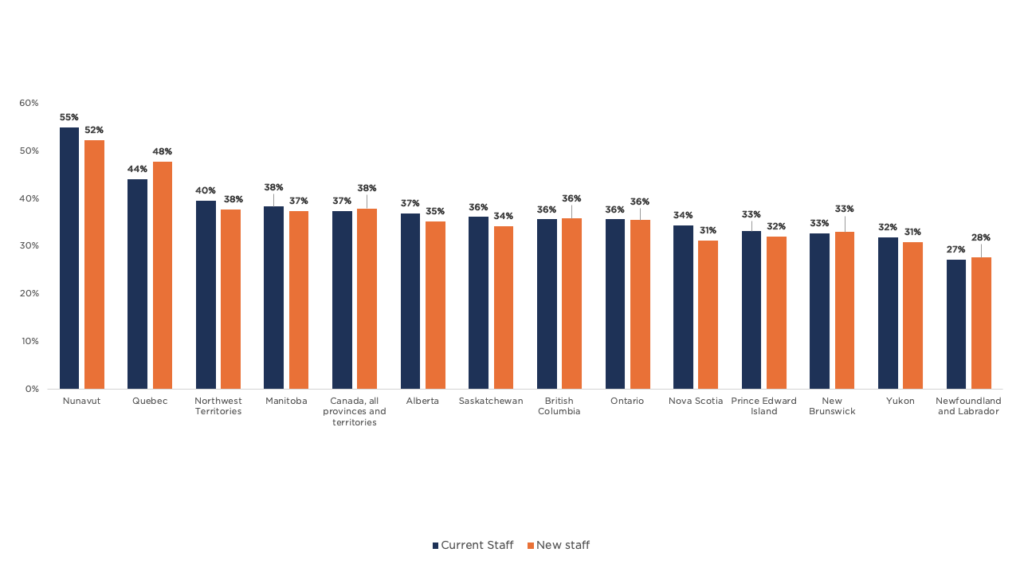
Data collected during the pandemic also reveal notable differences across provinces and territories. Surveyed firms in Nunavut and Québec were more likely to report difficulties finding the time and resources to train both new and current staff than firms in other provinces and territories. More than half of Nunavut firms (55 percent) and 44 percent of Québec firms said they faced challenges finding the time and resources to train current staff, while 52 percent of Nunavut firms and 48 percent of Québec firms reported challenges training new staff in the second quarter of 2022. While a little more than a third of firms in other provinces faced difficulties, reported challenges may be elevated in Québec because of the province’s legislated requirements to develop and execute training plans. That is, firms in Québec are more likely to experience challenges simply because they are required by law to make attempts to train, which is a requirement that firms in other provinces do not face.
Figure 17: Businesses in Québec and the Territories experienced the most difficulty training employees during the pandemic
Businesses that expect difficulties finding time and resources for training staff over the next three months, second quarter 2021
Source: Canadian Survey on Business Conditions
Sample: 16,000+ businesses
Who receives training?
Key points
Employers tend to invest in training not only for workers whose jobs require constant development of complex skills, but also according to perceptions of employee reliability, responsibility, and longevity.68 69 70 The 2012 PIAAC, while out of date, provides some insights into the levels and distribution of training opportunities among Canadian workers, including differences by education, skill, work arrangement, and age. Overall, 54 percent of Canadians who completed PIAAC reported participating in employer-sponsored education. About the same number reported the same in the 2020 Survey on Employment and Skills.71 iii This is five percentage points higher than the OECD average (49 percent), but lower than what is reported by workers in leading European countries like Denmark (65 percent), Finland (64 percent), Netherlands (62 percent), and Norway (61 percent). It is also slightly lower than the proportion of respondents in the United States who reported receiving employer-sponsored training (56 percent).
Figure 18: The proportion of Canadian adults receiving employer-sponsored training is slightly above average
Participation in employer-sponsored education, 2012

Source: Programme for the International Assessment of Adult Competencies (PIAAC)
Sample size: ~5,000 adults
Highly educated workers in Canada, and those with stronger problem-solving and technology skills, are more likely to say they have received training.
30 percent of respondents with less than a high school education reported participating in employer-sponsored training. This increased to 48 percent of high school graduates and 54 percent of those with post-secondary education. This is consistent with a 2009 Statistics Canada study that, using 2003 and 2005 data from the WES, found that low-wage, less-educated, or non-union workers receive less employer-sponsored training.72
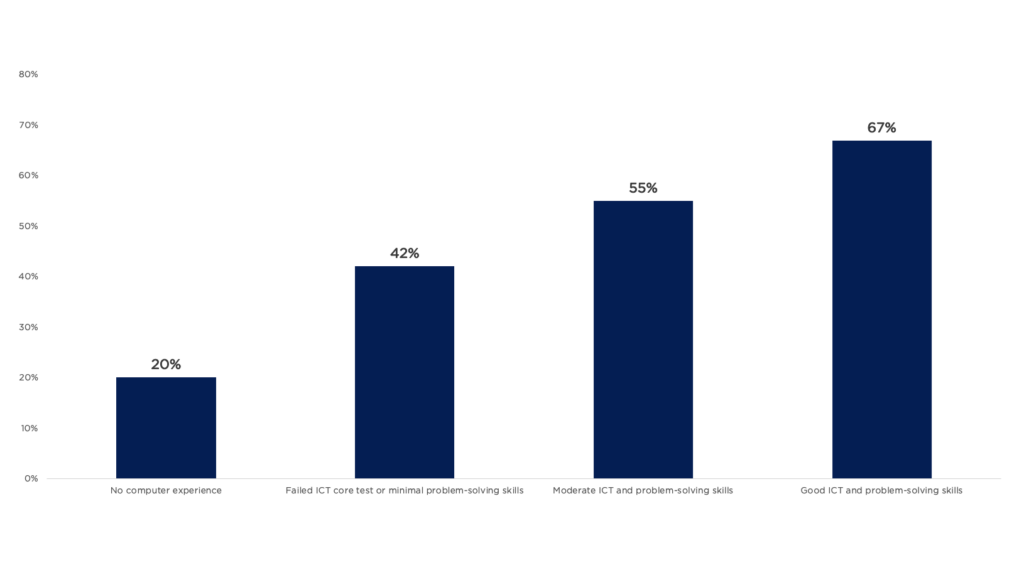
In terms of problem-solving and digital literacy, just 20 percent of adults with no computer experience reported participating in employer-sponsored training, while 55 percent of those with moderate, and 67 percent of those with good ICT and problem-solving skills, did so.
Figure 19: Training increases with education
Participation in employer-sponsored, on-the-job training in the past 12 months, 2012

Source: Programme for the International Assessment of Adult Competencies (PIAAC)
Sample size: ~5,000 adults
Figure 20: Training increases with general technology skills
Participation in employer-sponsored, on-the-job training in the past 12 months, 2012
Source: Programme for the International Assessment of Adult Competencies (PIAAC)
Sample size: ~5,000 adults
Employers are more likely to invest in training for full-time employees. Between 43 and 46 percent of part-time employees reported receiving employer-sponsored training versus 53 percent among full-time, fixed-term employees and 63 percent of full-time employees on indefinite contracts.73 iv Because training requires considerable time, resources, and uncertainty about returns on investment, employers appear to invest in employees with whom they are more likely to have long-term relationships. That said, while there is a 20 percentage point difference between training participation by part-time, fixed-term employees (43 percent) and full-time, indefinite employees (63 percent), part-timers are not entirely neglected, and nearly two-fifths of full-timers do not receive training.
Figure 21: Employers are more likely to invest in training for full-time employees
Participation in employer-sponsored, on-the-job training in the past 12 months, 2012

Source: Programme for the International Assessment of Adult Competencies (PIAAC)
Sample size: ~5,000 adults
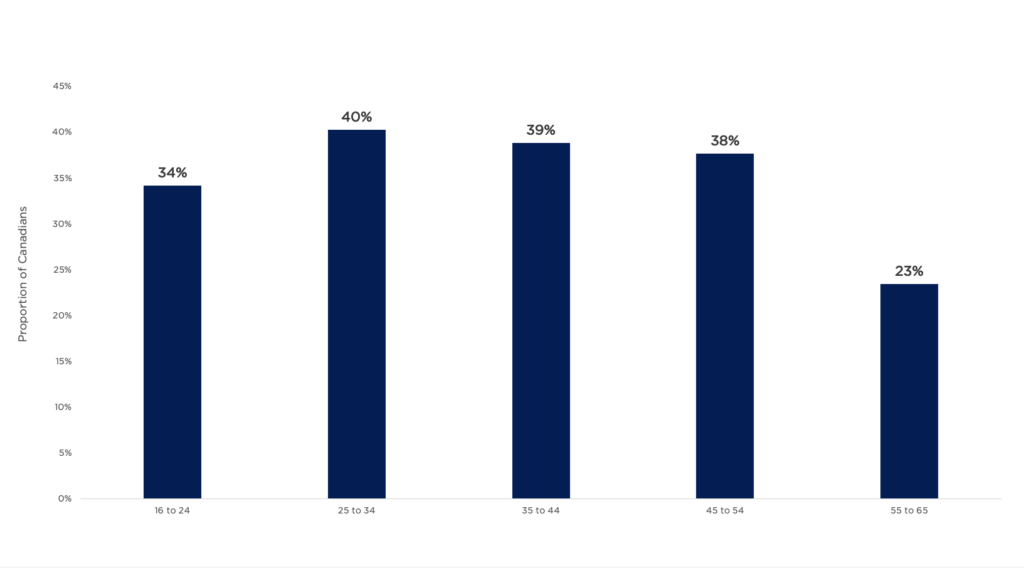
Using a slightly different question from the 2012 PIAAC dataset, we can also examine the incidence of training by age. When asked whether they attended any organized sessions for on-the-job training in the past 12 months, Canadians aged 25 to 54 were the most likely to say they had (38 to 40 percent). Both the youngest cohort (those aged 16 to 24) and the oldest cohort (those aged 55 to 64) were less likely to report attending organized sessions for on-the-job training, at 34 and 23 percent, respectively.
While the data does not provide definitive answers, we speculate that younger respondents may report lower rates of participation because they are more likely to be in education and/or employed in part-time, temporary positions. Older respondents may report lower rates in part because they and their employers see shorter timelines to achieve a positive return on training investment and/or because they have already acquired the skills and knowledge that are the focus of on-the-job training opportunities.
Figure 22: Canadians aged 25 to 34 most likely to receive training
Percentage of adults who attended any organized sessions for on-the-job training or training by supervisors or co-workers in the 12 months prior to being surveyed, 2012, by age group
Source: Programme for the International Assessment of Adult Competencies (PIAAC)
Sample size: ~5,000 adults
There is very limited data about employer-sponsored training participation by Indigenous status, race, immigration status, gender, and disability. The best available data come from the Survey on Employment and Skills conducted in 2020. This survey found that there is little difference between those who identify as men and women in terms of participation in employer-sponsored training, although this fails to capture differences across other gender identities (i.e., transgender, gender-fluid, and gender non-conforming individuals). They also found that immigrants and racialized workers are less likely to participate in employer-sponsored training.
Data on training participation by Indigenous and immigrant status appear to have been collected by the OECD’s PIAAC, but is not available for public analysis. Overall, much more comprehensive and representative data are needed to understand demographic differences in employer-sponsored training.
Types of training and skills development
Key points
Training varies significantly in both its content and mode of delivery. However, just as there are major gaps in our understanding of how much is being invested in training, there are significant gaps in the data on the kinds of training that is being provided.
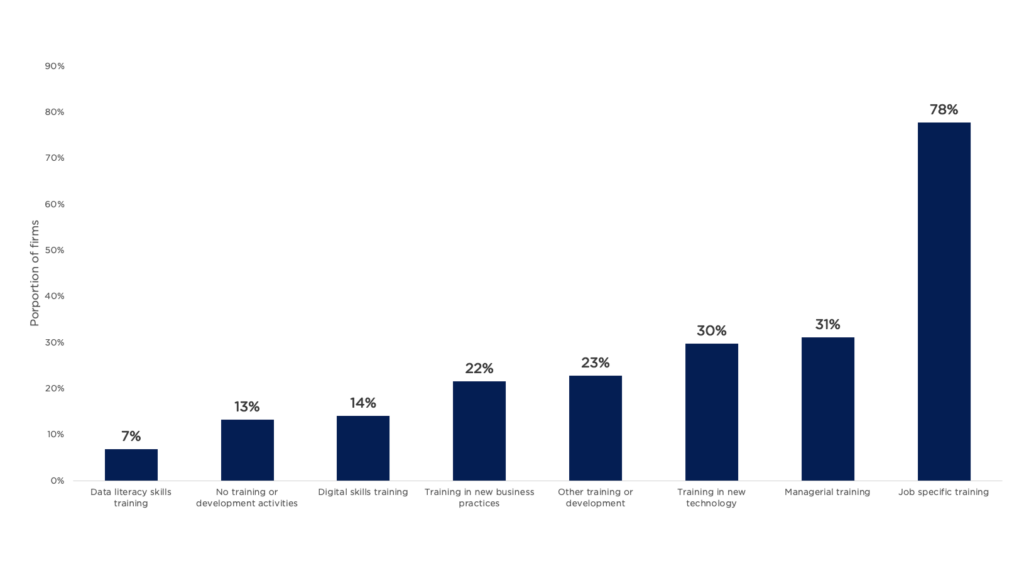
According to the 2019 Survey of Innovation and Business Conditions, 78 percent of firms reported providing job-specific training (by far the most common type) to their employees in 2019. Thirty-one percent said they provided employees with managerial training, and 30 percent reported providing training in new technology. However, the category of “job-specific training” is broad, and it is likely that the vast majority of training provided by employers falls within it. The data also indicate that firms are likely to provide more than one type of training. Surveys that are more precise about the different kinds of training administered would improve our understanding of exactly what employers are providing to their employees.
Figure 23: More than three-quarters of employers provide job-specific training
Training or development activities arranged or provided by the business, 2019
Source: Survey of Innovation and Business Strategy
Sample: 14,985 businesses for 2019 release
Employers have a range of options for delivering training to employees. However, numerous sources indicate that employers prefer in-house, on-site training modes. The 2020 Survey on Quality of Employment shows that, over the 12 months prior to being surveyed, about half of employees who participated in training activities received their training at their place of work and during work hours (51 percent), while eight percent received their training at their place of work but outside working hours. By contrast, 13 percent of those who received training pursued it outside of the workplace during working hours. Twenty-one percent reported experiencing more than one mode of training arrangement.
The preference for place-of-work training is also seen in the Workplace and Employee Survey (discontinued in 2006). Analysis by Dostie (2013) shows that 34 percent of employers offered on-the-job training, while 22 percent offered classroom training. The study noted that classroom training is more likely to enhance productivity—likely due to its formal and rigorous content—but at the same time, other analysis showed that the provision of classroom and on-the-job training is highly correlated; that is, an employer that provides one is more likely to provide the other as well.74
Figure 24: Most training happens at the workplace

Source: Survey on Quality of Employment
Sample: 12,000 employees
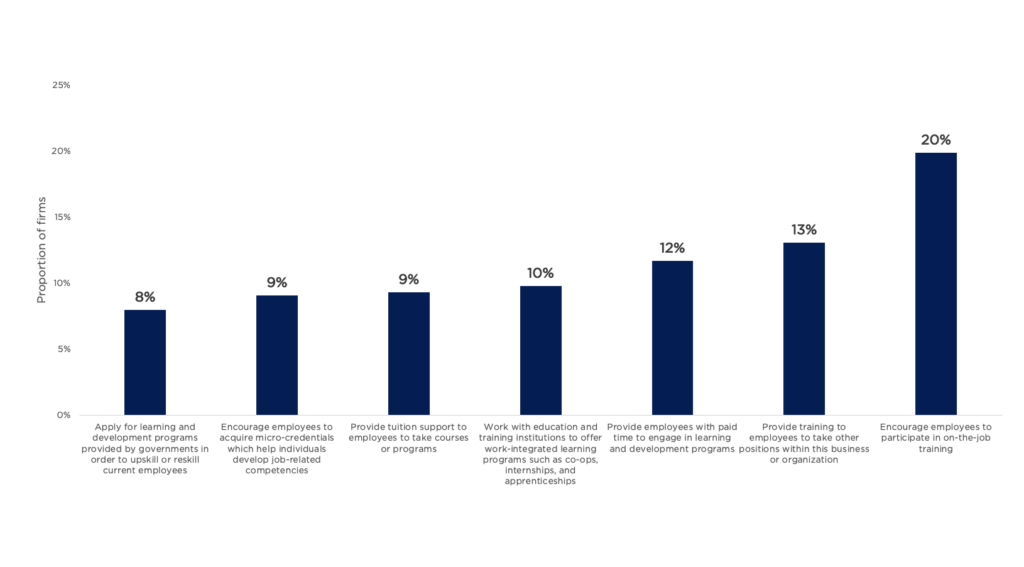
Statistics Canada’s more recent Canadian Survey on Business Conditions confirms the preference for place-of-work delivery modes while offering additional insights. In the first quarter of 2022, 20 percent of surveyed firms reported encouraging employees to participate in on-the-job-training and 13 percent were providing training for employees to take over other positions within the organization. Twelve reported providing employees with paid time to engage in learning and development programs, providing tuition support to employees to take courses or programs (9 percent), or encouraging employees to acquire micro-credentials (9 percent).
Figure 25: Businesses favour on-the-job training over classroom environments
Plans regarding recruitment, retention and training over the next 12 months, first quarter of 2022
Source: Canadian Survey on Business Conditions
Sample: 16,000+ businesses
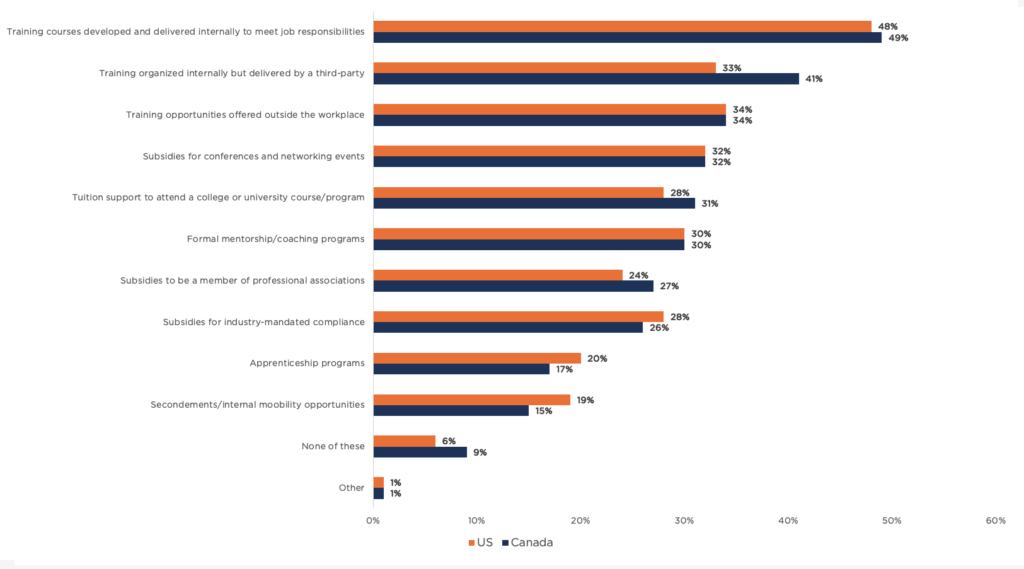
Finally, some insights about modes of delivery—and how Canadian and U.S. firms compare—can be found in the D2L Training Survey. Roughly half of surveyed Canadian (49 percent) and American (48 percent) firms said they developed and delivered training courses to employees internally to meet job responsibilities. Forty-one percent of Canadian and 33 percent of American firms said they organized training internally, but had a third party deliver the content. Fewer employers offered training opportunities outside the organization, including off-the-job training (34 percent), subsidies for conferences and networking events (32 percent), and tuition support to attend a college or university course or program (31 percent).
Figure 26: Employers most likely to develop and deliver training internal
Does your organization provide any of the following professional development opportunities to support ongoing learning for employees?
Source: D2L and Innovative Research Group 2021
Sample: 400 SMEs in Canada & US
Support and incentives for training and skills development
Key points
Policies and programs to incentivize and support employer-sponsored training may be necessary given that firms appear to under-provide training for a variety of reasons, whether attitudinal, informational, or financial. In general, interventions can include information campaigns, capacity building, financial incentives, direct public provision of training, and regulatory instruments.75
In Canada, there are few policies and programs specifically designed to improve the employer-sponsored training landscape. For those that do exist, data on their impact is limited. In this section, we outline what is known about two prominent employer-sponsored training programs: the Canada Job Grant (CJG) (a financial incentive program) and Québec’s One Percent Training Law (which takes a direct regulatory approach).
The CJG was launched in 2014 as a part of the Canada Job Fund (CJF), a series of bilateral agreements between the federal government and the provinces and territories to increase employer involvement and investment in training, among other things. The CJG was an essential component of these agreements, with every province and territory outside of Québec having its own stream (e.g., the Canada–Alberta Jobs Grant). Québec’s CJF agreement did not include a jobs grant stream because of the province’s existing framework that encourages employer investments in training (discussed below). The larger CJF was replaced by the Workforce Development Agreements program in 2017. There is no requirement in the program to deliver the CJG, although some provinces continue to do so. The CJG program is open in Manitoba as of August 202276 but is closed in New Brunswick, Prince Edward Island and Nova Scotia.77
Four principles were at the heart of the training-related components of the CJF–CJG agreements:
Beyond these core principles, the CJG had different requirements for each province and territory, as negotiated between the federal and provincial and territorial governments. For example, while the Canada–Alberta Job Grant allows employers to receive 66 to 100 percent of the cost of training up to a maximum of $10,000 per trainee per fiscal year, the Canada–Ontario Job Grant adjusts funding by firm size. Large employers (with more than 100 employees) can receive 50 percent of the cost of training, up to a maximum of $10,000 per trainee, while smaller employers can receive 100 percent of training expenditures up to a maximum of $15,000 per trainee. For most of the streams, funding covers the costs of third-party trainer fees; tuition, student, and examination fees; textbooks and course materials; and training-related software.79
Impact
Data on the reach and impact of the CJG are sparse and dated. A review of the CJG program prepared in 2016 for the Forum of Labour Market Ministers offers some early insights:80
The review concluded that the job grant program overall was administratively onerous and that a large portion of the funds was supporting training that employers would have undertaken anyway.81 Still, because data are limited, it is difficult to get a clear picture of the impact and value of the CJG. It would be helpful if provinces and territories made the data they capture through the program publicly accessible. A survey of participating employers and employees to better understand activities and impact would also be worthwhile.
In 1995, the Québec National Assembly adopted Law 90, commonly referred to as the “One Percent Training Law.” At the time, the law required firms with a payroll of $1 million or more to spend at least one percent of their payroll on training. If firms had no eligible training expenditures, or if their expenditures fell below the one percent of payroll threshold, then they were required to pay into the Workforce Skills Development and Recognition Fund (WSDRF) at a rate equal to the difference between their expenditures on training and one percent of their total payroll.82
The payroll threshold has changed many times: declining to $250,000 in 1997, returning to $1 million 2003, and increasing to $2 million in 2015. The 2015 threshold increase was intended to lighten the administrative burden on smaller employers. As a result of the 2015 amendment, the number of employers who were required to comply with the law decreased to 8,856 from 17,667, and the declared investment in training declined to $929 million in 2016 from $1.2 billion in 2014. The overall number of contributors and contribution amounts to the WSDRF also declined dramatically.83
Employers covered by Québec’s training law (2013 to 2016)
| 2013 ($1M) |
2014 ($1M) |
2015 ($2M) |
2016 ($2M) |
|
| Number of employers covered by the law | 17,156 | 17,667 | 8,856 | 8,436 |
| Payroll (millions $) | 113.9 | 115.1 | 107.8 | 94.1 |
| Declared investment in training (millions $) | 1.19 | 1.23 | 1.08 | .93 |
| Rate of declared investment in training | 1.0 | 1.1 | 1.0 | 1.0 |
| Proportion of covered employers who declared investment of at least 1% | 85.9 | 86.2 | 89.1 | 91.3 |
| Number of employers contributing to the WSDRF | 2,428 | 2,435 | 965 | 736 |
| Total contributions to the WSDRF (millions $) | 29.7 | 32 | 22 | 20 |
Source: Québec, Loi favorisant le développement et la reconnaissance des compétences de la main-d’œuvre: RAPPORT QUINQUENNAL 2013–2018.
Impact
According to the results of Québec’s 2014 Survey on Employment Training Practices, 86.4 percent of employers subject to the regulations stated that they had invested at least one percent of their payroll in training in 2014. Of all employers surveyed, 61 percent invested one to 1.5 percent of payroll in training, while 26 percent invested 1.5 percent or more. The remaining 14 percent of employers who were required to invest at least one percent of their payroll in training invested less than one percent or none at all. When asked why they did not invest more, or at all, most said they already made sufficient investments in training to meet their training needs.84
Did this law increase training?
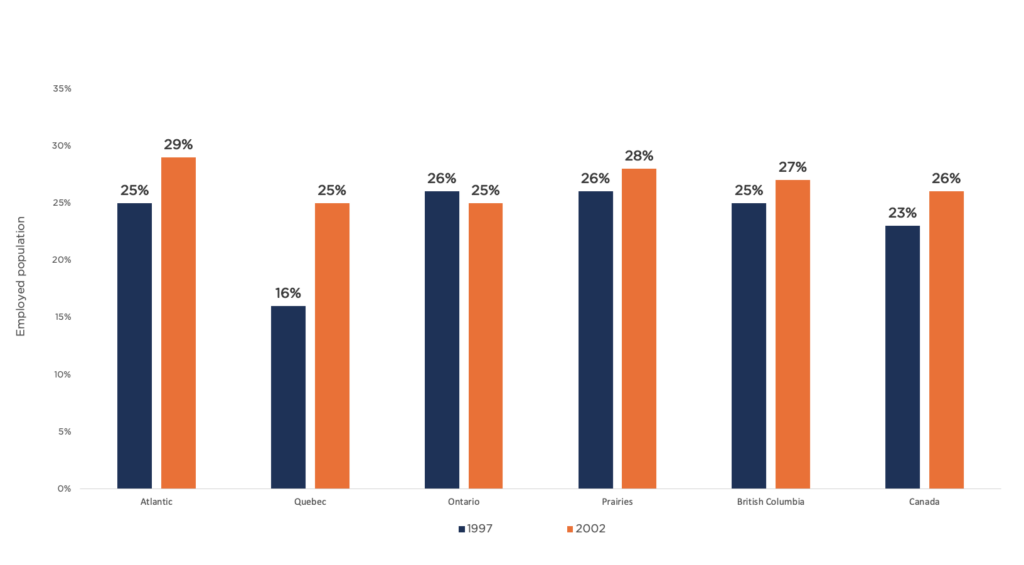
Prior to Québec’s One Percent Training Law, Québec had been a laggard province on employer-sponsored training, and the law appears to have had a positive impact in helping to close much of the gap. Examining data from Statistics Canada’s Adult Education and Training Survey, Belanger & Robitaille (2008) showed that between 1997 and 2002—the early years of the training law’s operation—the participation rate for employer-sponsored training among employed adults increased more dramatically in Québec than other provinces, growing roughly nine percentage points to 25 percent from 16 percent. Indeed, the growth was roughly three times greater than the increase across Canada as a whole.85
This being the case, while it is likely that the training law improved Québec’s employer-sponsored training performance, it managed to lift it only to the national average, at least in the early years. Data to understand the impact on performance over the next two decades are not available. Moreover, while the training law has achieved some success, it is hard to say whether a similar law in other provinces might have a positive impact, given these provinces’ higher starting levels. Why Québec had a much lower training baseline prior to the adoption of the training law is not clear from available data or literature.
Figure 27: Quebec saw the fastest growth of employer-sponsored training rates between 1997 and 2002
Participation rates in employer-sponsored training, 1997 & 2002
Source: Bélanger & Robitaille (2008) using Statistics Canada Adult Education and Training Survey
Sample: >15,000
How did training change?
Using Statistics Canada’s Workplace and Employee Survey, Gagnon and Smith (2013) investigated the impact of the training law on the kinds and modes of training offered between 1999 up to 2005. They found that, when training is offered in Québec, it is more likely to be formal classroom training (35 percent) than informal on-the-job training (18 percent)—a difference of 17 percentage points versus a difference of just one to five percentage points in other provinces. Québec employees also reported higher use of external training providers in formal training. Of those who reported receiving formal training in Québec, 67 percent in goods-producing industries and 64 percent in services-providing industries said the training was provided by external training providers.86
The authors conclude that the law explains a significant portion of why Québec employers are more likely to pursue formal training through external providers. In order to comply with the regulation, Québec employers must use verified third-party institutions to provide training services to their employees, as opposed to offering less formal, on-the-job forms of training.87
Figure 28: Training in Quebec is much more likely to take the form of formal classroom training
Employee proportion reporting formal and OJT training: annual average, 1999-2005
Source: Gagnon and Smith (2013) using the Workplace and Employee Survey
Sample: ~6,000 employers, ~24,000 employees
Figure 29: Quebec has the highest instance of use of external training providers
Means of training provision (formal training): annual averages, 1999-2005
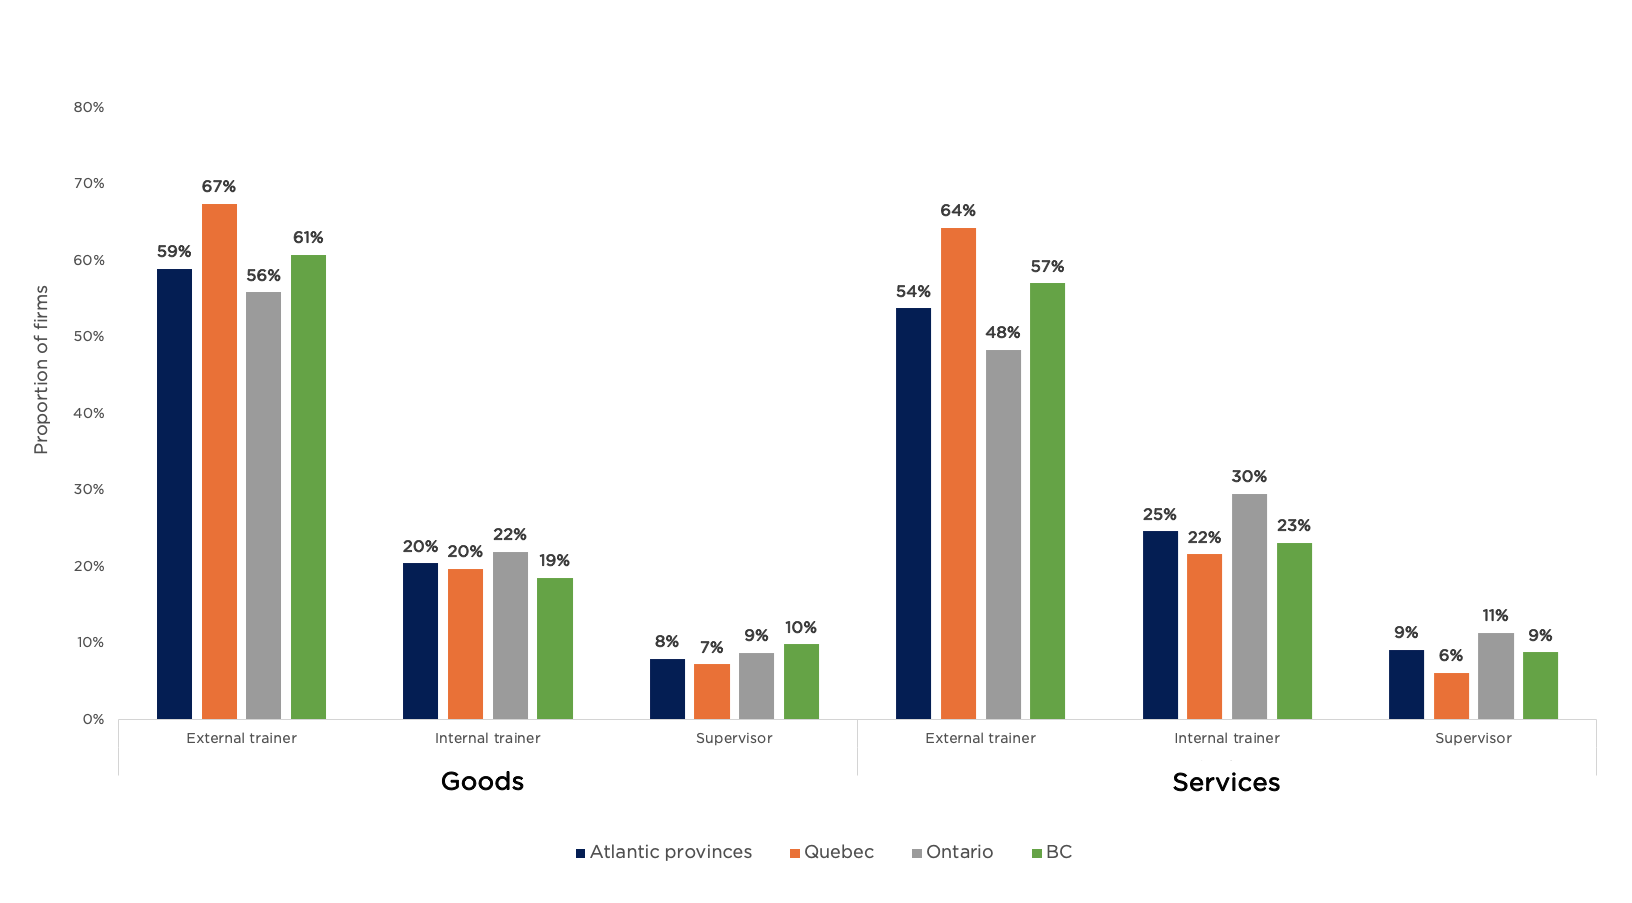
Source: Gagnon and Smith (2013) using the Workplace and Employee Survey
Sample: ~6,000 employers, ~24,000 employees
Conclusion
The picture of employer-sponsored training offered here is admittedly imprecise and dated. This is entirely a function of the paucity of recent and reliable data in the Canadian context. Stitching together the data that are available suggests that employer-sponsored training in Canada is limited overall, concentrated among large firms in certain sectors and regions, and offered primarily to workers with higher education who are employed in management, professional, or technical roles and are in their core working years (25 to 54). In short, despite the importance of employer-sponsored training to competitiveness, productivity, wages, and employee well-being, Canadian firms offer limited opportunities to a small slice of the population.
These conclusions must be treated with a high degree of caution given that they draw from data that are largely out of date, unreliable, and/or ill-suited for comparison across time frames and jurisdictions. Where the insights are more reliable, they often rely on data that are a decade old or more; where insights are timelier, they tend to rely on data drawn from small and skewed samples. Analysis and policy-making on employer-sponsored training in Canada occur largely in the dark. Gaining a clearer picture of the employer-sponsored training ecosystem and whether policy interventions are achieving results or wasting public resources requires much better data.
The importance of skills development to competitive and equitable economies is beyond question. The fact that Canada appears to be lagging its international peers in employer-sponsored training—while also lacking good data to really know for sure—poses a real risk to the economy and society. The lack of timely and reliable data also undermines efforts to have balanced discussions about responsibility for training among educators, employers, governments, and learners, and makes policy design and assessment particularly challenging. To deliver on the promise of a strong economy that works for all, we need to do a better job of providing and tracking employer-sponsored training.
Acknowledgements
Authors
Daniel Munro
Co-Founder & Principal, Shift Insights
Dr. Daniel Munro is a Senior Fellow, teacher and the Director of Policy Projects in the Innovation Policy Lab at the Munk School of Global Affairs and Public Policy, Researcher in Residence at Actua, and Co-Director of Shift Insights. Previously, he was a Research Fellow at the Brookfield Institute for Innovation + Entrepreneurship (2017-2021), Associate Director of Public Policy at the Conference Board of Canada (2008-2017), and Senior Analyst at the Council of Canadian Academies (2007-2008). Dan’s research spans science, technology, and innovation policy; skills and education; and applied ethics, including the ethics of innovation.
Creig Lamb
Co-Founder & Principal, Shift Insights
Creig Lamb is Co-Director of Shift Insights, a research organization focused on innovation and technology policy. Prior to Shift, Creig worked as a Senior Policy Advisor with the Brookfield Institute for Innovation + Entrepreneurship (BII+E), where he wrote extensively about technology, changing skills demands, and preparing firms and workers for a changing economy.
We would like to thank Noel Baldwin, Tony Bonen, Behnoush Amery, Nancy Adossi, Steve Richter, Anthony Mantione, Michael Willcox and Suzanne Spiteri for their contributions to this report.

The Future Skills Centre (FSC) is a forward-thinking centre for research and collaboration dedicated to preparing Canadians for employment success. We believe Canadians should feel confident about the skills they have to succeed in a changing workforce. As a pan-Canadian community, we are collaborating to rigorously identify, test, measure, and share innovative approaches to assessing and developing the skills Canadians need to thrive in the days and years ahead. The Future Skills Centre was founded by a consortium whose members are Ryerson University, Blueprint ADE, and The Conference Board of Canada, and is funded by the Government of Canada's Future Skills program.

The Labour Market Information Council (LMIC) is a non-profit research institute dedicated to ensuring Canadians have the necessary information and insights to navigate the changing world of work. Our mission is to empower Canadians with timely and reliable labour market information in an engaging way that supports their decision-making process.

Shift Insights is a research and policy shop focused on the social, economic and technological challenges and opportunities facing Canada. We provide timely research and advice to enhance understanding and improve decision-making across a wide range of policy and strategy priorities.
Appendix A
An inventory and analysis of training data in Canada
| Survey | Publisher | Year(s) | Sampling | Design | Training details | Limitations |
| Workplace and Employee Survey (WES) | Statistics Canada | 1999 to 2006 | The WES used a stratified random sampling design.
Employer sample:
Employee sample:
|
The WES was a panel survey of both employers and employees, allowing for longitudinal analysis of business and employee events and their impacts on workers and workplaces.
Employer component The target population for the employer component was all business locations operating in Canada that paid employees in March of the survey year, with some minor exceptions. Roughly the same employers were tracked over 8 years, although the sample was adjusted over time to account for attrition.
Employee component The WES surveyed employees of workplaces that were included in the employer survey. A maximum of 24 employees were sampled from each workplace using a probability mechanism. In workplaces with fewer than 4 employees, all employees were selected. |
The WES provided the most comprehensive and only longitudinal data set on employer-sponsored training from both an employee and employer perspective in Canada.
The WES was notable for distinguishing between classroom and on-the-job training. With respect to employer-sponsored training, WES collected data on the following:
|
The WES was discontinued, and its data are now more than 15 years out of date.
The WES asked employees a number of questions related to training activities, but Statistics Canada did not make the data publicly available. |
| Programme for the International Assessment of Adult Competencies (PIAAC) | OECD | 2012
The next cycle of PIAAC that includes Canada will take place in 2022–2023. |
PIAAC is fielded in more than 40 countries, with samples of approximately 5,000 adults aged 16 to 65 in each participating country.
|
PIAAC is an assessment of adult skills, including literacy, numeracy, and problem-solving using technology. It also gathers information and data on how adults use their skills at home, at work, and in the wider community, and asks questions about education and training activities offered to and pursued by respondents.
The survey is designed to allow for international comparisons, despite using different national languages. |
PIAAC provides an employee perspective on skills training. It is especially helpful in providing cross-country comparisons as well as tombstone data that allow for analysis by age, educational attainment, and other variables.
With respect to employer-sponsored training, PIAAC collects data on the following:
|
Employer-related training data from PIAAC for Canada is out of date. (PIAAC’s second cycle is scheduled for 2022-23, but current data are 10 years out of date).
The terminology and questions related to employer-sponsored training are different than those that used in many national surveys, making comparisons difficult. Offers useful employee-provided information on training activities, but lacks employer-provided data on training investment levels, motives and barriers. |
| Career Development in the Canadian Workplace: National Business Survey | CERIC | 2013 | 500 senior officials in businesses; mainly service industries; reasonable geographic distribution; nearly half (46 percent) of respondents had fewer than 10 employees. | This survey was designed to understand the state of career development in the Canadian workplace, with a focus on youth unemployment, skills shortages, and talent recruitment and training.
|
The training-specific data explore whether senior officials believe training is a viable method to fill skills gaps; their willingness to invest in training; concerns about losing employees after investing in training; and the kinds of training being provided. | The survey is skewed toward smaller businesses in the service sector, limiting its generalizability and comparability to other surveys. |
| Survey of Advanced Technology (SAT) | Statistics Canada | 2014 | The SAT used a stratified simple random sample design.
n = 11,887 (selected from the survey population of 84,322 from Statistics Canada's Business Register) The survey population was stratified by industrial grouping, region, and 3 size classes based on number of employees per enterprise.
|
The SAT was designed to provide statistical information on the use of advanced technologies by Canadian firms in key sectors: forestry and logging; oil and gas extraction; mining and quarrying; utilities; manufacturing; wholesale and retail trade; transportation and warehousing; and professional, scientific, and technical services.
It included some questions on training related to technology adoption.
|
The SAT examined training from the perspective of technology adoption.
Specifically, it asked firms:
|
The SAT is out of date (it was last run in 2014).
The survey collected some data on training, but only related to technology adoption. Therefore, its results are not generalizable. |
| Survey on Employment Training Practices in Québec | Institut de la statistique du Québec on behalf of the Labour Market Partners Commission | 2014 | Sample of employers subject to Québec’s 1% training law.
n = 6,400 |
The Labour Market Partners Commission had the Institut de la statistique du Québec conduct a survey of employers in Québec who were subject to the 1% training law in 2014 (i.e., those with payrolls of $2 million or more). | The survey asks:
Data are reported in aggregate and disaggregated by firm size, industry, and region. |
The survey offers an exceptionally good snapshot of training activities among Québec employers who were subject to the 1% training law in 2014.
However, the raw data do not appear to be available for independent analysis (results are included in ministry reports on the 1% training law); the survey was conducted only in 2014, and its current and future status is unknown; and the survey only covered Québec, so no comparisons with other provinces are possible. |
| Learning and Development Outlook (LDO) Survey | Conference Board of Canada | 1993 to 2016 | Non-random, non-anonymous survey of a sample of the Conference Board’s paying network members interested in learning and development issues (i.e., employers in public and private sector).
n = 100 to 200 (n varied by year; a small subset of respondents responded every year.) |
The Conference Board’s LDO was designed to collect time-series data on employers’ training and employee development activities. While the sample is small and skewed, some consistency among respondent organizations allowed for some longitudinal analysis. | The LDO asked about employer spending on training (including past spending and future intentions), types of training, purposes of training, barriers, and overall training and development plans and strategies. | The LDO appears to have been discontinued after the 2016 iteration.
The small, non-random sample makes the LDO rather unreliable. Given that respondents were already interested in learning and development issues, the responses likely present a more positive picture of training activity than is the general case in Canada. The LDO’s time-series data—while based on a small-n and likely skewed above average employer spending levels—provide a somewhat useful indicator of the direction of trends. |
| Survey of Innovation and Business Strategy (SIBS) | Statistics Canada | 2009 to 2019 (ongoing)Re-run every 3 years beginning in 2009. |
This is a sample survey with a cross-sectional design.
n = 14,985 enterprises (selected from a target population of 72,539 enterprises with an expected response rate of 50 percent by stratum.) |
First released in 2009, SIBS is an economy-wide survey focused primarily on business performance, innovation, and science and technology.
|
Because SIBS is largely focused on innovation, many training-related questions pertain to innovation. Some training-related questions are not explicitly linked to innovation, but respondents may be primed to answer through a “training related to innovation” frame.
Relevant data include:
|
SIBS is perhaps the most comprehensive ongoing data source when it comes to employer-sponsored training in Canada. However, its training content taxonomy differs from other sources, its data on training expenditures is weak, and the “innovation” framing may limit its applicability to training more generally. |
| Survey on Quality of Employment (SQE) | Statistics Canada | 2021 | This is a sample survey of individuals with a cross-sectional design.
n = 12,000 initial sample (The SQE frame was stratified by province, and a simple random sample of dwellings was selected independently within each province.)
|
The survey aims to understand job quality in Canada from the perspective of workers.
The target population for the survey is individuals aged 15 years of age or older who worked in a job or business in the preceding 2 years. |
The SQE asks a limited number of questions regarding training, including:
|
While the SQE provides an employee perspective on training, it asks very few questions that are specific to training, and frames them in language that is inconsistent with other surveys and data. |
| Employer- Supported Skills Development Survey | D2L and Innovative Research Group | 2021 | Small- and medium-sized enterprises (SMEs) (20 to 499 employees).
n = 400 (Canada) Employees n = 400 (Canada) Samples weighted to a representative sample by age, gender, region, and job titles. |
D2L commissioned Innovative Research Group to conduct “snapshot” surveys of SMEs and employees in Canada and the United States to acquire more up-to-date data on training intentions, activities, financial supports, and barriers.
The surveys were fielded in December 2021. It is not clear whether there will be future iterations. |
The D2L/IRG surveys ask questions about:
|
The D2L survey has been fielded only once, and future plans are unclear. That said, it offers better and more up-to-date data than many other surveys, especially those conducted by other think tanks.
The sample targets only SMEs (20 to 499 employees) and their employees, providing no data on the smallest and largest firms and their employees. The n = 400 sample size for each survey and concern for representative weighting offers better results than small-n, skewed think-tank surveys, but is below the rigour of Statistics Canada offerings. Question wording does not allow for direct comparisons with other surveys and sources. |
| Survey on Employment and Skills
|
Future Skills Centre, Diversity Institute and the Environics Institute | 2020 to 2022
(4 waves thus far; ongoing.) |
5,000 respondents aged 18 years and older in all jurisdictions across Canada. | The survey began as a project designed to explore Canadians’ experiences with the changing nature of work, including technology-driven disruptions, increasing job insecurity, and shifting skills requirements.
Following the onset of the COVID-19 pandemic, the survey was expanded to investigate the impact of the crisis on Canadians’ employment, earnings, and work environments. The project now includes 4 waves of data collection, from spring 2020 to spring 2022. |
The focus of the survey and the questions asked change from wave to wave. The first wave, published in September 2020, asks individuals whether they participated in employer-sponsored training. These data are broken down by key demographic profiles, such as age, education, gender, immigrant status, union status, and whether an individual is racialized. | The focus of the survey and the data being collected change almost entirely from wave to wave, preventing any longitudinal analysis. Only the first wave of the survey focused on questions related to employer-sponsored training. While the employee focus and demographic breakdowns are useful, more data (particularly with respect to race and gender) are required to get a full picture of who receives training. |
| Canadian Survey on Business Conditions | Statistics Canada | 2020 to present (ongoing)(quarterly) |
This is a sample survey with a cross-sectional design. The survey uses a stratified random sample of business establishments classified by geography, industry sector, and size. Responses are voluntary.
n = 16,000+ businesses
|
Started as a partnership between the Canadian Chamber of Commerce and Statistics Canada, the survey collects information on how businesses are adapting to COVID-19 and other emerging issues.
Timely and released quarterly, each survey is slightly adjusted and focuses on topics of evolving interest.
|
The Survey on Business Conditions is helpful for understanding evolving challenges and responses to them among businesses across the country during the COVID-19 pandemic and subsequent economic downturns. It asks some helpful questions regarding employer-sponsored training, including:
|
The survey is frequent, timely, and drawn from a substantial sample.
However, the questions and their wording change with each wave, making it difficult to reliably identify trends and developments and challenging to compare results with other surveys. The questions tend to ask about intentions rather than recent investment and activities. This provides less reliable information (because future behaviour may not match the stated intentions). |
| Skills Survey | Business and Higher Education Roundtable and Business Council of Canada | Every 2 years:
2014, 2016, 2018, 2020, and 2022 |
This survey samples members of the Business Council of Canada. In 2022, it received responses from 95 organizations. | The survey is designed to provide non-representative insights regarding business investments and behaviours when it comes to skills demands and challenges and training practices. | The most important question about training examines how much employers allocated to employee learning and development. | While this survey is timely and does provide insight into employer expenditures on training, the small sample size makes it hard to generalize the findings to a wider population or to draw comparisons to other more representative surveys. |
Footnotes
i For an overview of education and skills development systems in Canada, see Munro, Stuckey and. MacLaine (2014)Skills—Where Are We Today? The State of Skills and PSE in Canada(Ottawa: Conference Board of Canada) https://www.conferenceboard.ca/e-library/abstract.aspx?did=6603; D. Munro (2019)Skills, Training and Lifelong Learning(Ottawa: Public Policy Forum) https://ppforum.ca/publications/skills-training-and-lifelong-learning/
ii In 2006 dollars.
iii The 2020 Survey on Employment and Skills found that 51 percent of Canadians in the labour force participated in a work-related training course to improve their skills that was provided by their employer.
iv This largely corresponds to the 2020 Survey on Employment and Skills in which 57 percent of full-time employees and 54 percent of part-time employees said they participated in a training course that was provided by their employer.
Endnotes
1 Dostie & Montmarquette (2007). Employer-Sponsored Training in Canada: Synthesis of the Literature using Data from the Workplace and Employee Survey. Human Resources and Social Development Canada.
2 Ngoc Thang (2010). The relationship between training and firm performance: A literature review. Research and Practice in Human Resource Management, 18(1), 28-45.
3 Haelermans & Borghans (2011). Wage Effects of On-the-Job Training: A Meta-Analysis. IZA Discussion Paper No. 6077.
4 Dostie (2013). Estimating the Returns to Firm-Sponsored On-the-Job and Classroom Training. Journal of Human Capital, 7(2).
5 Percival, Cozzarin, & Formaneck (2013). Return on investment for workplace training: the Canadian experience. International Journal of Training and Development, 17(1).
6 OECD. (2021). Training in Enterprises. New Evidence from 100 Case Studies, Getting Skills Right.
7 Business + Higher Education Roundtable, “Work-Integrated Learning 101.” https://bher.ca/wil-hub/explore-wil/work-integrated-learning-101
8 Bessen (2015) Learning By Doing: The Real Connection Between Innovation, Wages, and Wealth (New Haven: Yale University Press).
9 OECD. (2021). Training in Enterprises. New Evidence from 100 Case Studies, Getting Skills Right.
10 OECD. (2021). Training in Enterprises. New Evidence from 100 Case Studies, Getting Skills Right.
11 OECD. (2021). Training in Enterprises. New Evidence from 100 Case Studies, Getting Skills Right.
12 Katz and Ziderman. (1990. Investment in General Training: The Role of Information and Labour Mobility. The Economic Journal, 100 (403), pp. 1147-1158.
13 Becker (1962). Investment in Human Capital: A Theoretical Analysis. The Journal of Political Economy. 70 (5). 9-49.
14 Dostie (2013). Estimating the Returns to Firm-Sponsored On-the-Job and Classroom Training. Journal of Human Capital, 7(2).
15 Ngoc Thang (2010). The relationship between training and firm performance: A literature review. Research and Practice in Human Resource Management, 18(1), 28-45.
16 Bessen (2015) Learning By Doing: The Real Connection Between Innovation, Wages, and Wealth (New Haven: Yale University Press).
17 Ngoc Thang (2010). The relationship between training and firm performance: A literature review. Research and Practice in Human Resource Management, 18(1), 28-45.
18 OECD. (2021). Training in Enterprises. New Evidence from 100 Case Studies, Getting Skills Right.
19 Dostie (2013). Estimating the Returns to Firm-Sponsored On-the-Job and Classroom Training. Journal of Human Capital, 7(2).
20 OECD. (2021). Training in Enterprises. New Evidence from 100 Case Studies, Getting Skills Right.
21 Ngoc Thang (2010). The relationship between training and firm performance: A literature review. Research and Practice in Human Resource Management, 18(1), 28-45.
22 Munro, Stuckey and MacLaine (2014) Skills—Where Are We Today? The State of Skills and PSE in Canada (Ottawa: Conference Board of Canada) https://www.conferenceboard.ca/e-library/abstract.aspx?did=6603
23 OECD. (2021). Training in Enterprises. New Evidence from 100 Case Studies, Getting Skills Right.
24 Botev, Egert, Smidona, & Turner (2019). New Macroeconomic Measure of Human Capital with Strong Links to Productivity. OECD.
25 Cammeraat, Samek, & Squicciarini. (2021). The Role of Innovation and Human Capital for the Productivity of Industries. OECD Directorate for Science, Technology and Innovation.
26 OECD. (2021). Training in Enterprises. New Evidence from 100 Case Studies, Getting Skills Right.
27 Dostie (2018). The Impact of Training on Innovation. ILR Review, 71 (1).
28 Dostie (2013). Estimating the Returns to Firm-Sponsored On-the-Job and Classroom Training. Journal of Human Capital, 7(2).
29 Percival, Cozzarin, & Formaneck (2013). Return on investment for workplace training: the Canadian experience. International Journal of Training and Development, 17(1).
30 Ngoc Thang (2010). The relationship between training and firm performance: A literature review. Research and Practice in Human Resource Management, 18(1), 28-45.
31 OECD. (2021). Training in Enterprises. New Evidence from 100 Case Studies, Getting Skills Right.
32 Dostie & Montmarquette (2007). Employer-Sponsored Training in Canada: Synthesis of the Literature using Data from the Workplace and Employee Survey. Human Resources and Social Development Canada.
33 Percival, Cozzarin, & Formaneck (2013). Return on investment for workplace training: the Canadian experience. International Journal of Training and Development, 17(1).
34 Vu, Lamb & Willoughby (2019). I, Human: The digital and soft skills driving Canada’s labour market. The Brookfield Institute for Innovation + Entrepreneurship.
35 OECD. (2021). Training in Enterprises. New Evidence from 100 Case Studies, Getting Skills Right.
36 Frey, Buettgen & Pietsch (2017). Can Training Help Retain Professional Services Employees? An Empirical Analysis. Academy of Management.
37 Van Reenen & Dearden (2006). The Impact of Training on Productivity and Wages: Evidence from British Panel Data. Oxford Bulletin of Economics & Statistics.
38 Konings & Vanormelingen (2010). The Impact of Training on Productivity and Wages: Firm Level Evidence. Iza Discussion Paper.
39 Haelermans & Borghans (2011). Wage Effects of On-the-Job Training: A Meta-Analysis. IZA Discussion Paper.
40 Munro (2019) Skills, Training and Lifelong Learning (Ottawa: Public Policy Forum) https://ppforum.ca/publications/skills-training-and-lifelong-learning/
41 Finance and insurance; forestry; mining, oil and gas; information and culture; and primary product manufacturing.
42 Percival, Cozzarin, & Formaneck (2013). Return on investment for workplace training: the Canadian experience. International Journal of Training and Development, 17(1).
43 D2L (2022), Enabling Upskilling at Scale (Kitchener: D2L).
44 D2L (2022), Enabling Upskilling at Scale (Kitchener: D2L).
45 CERIC. (2013). Career Development in the Canadian Workplace.
46 D2L (2022), Enabling Upskilling at Scale (Kitchener: D2L).
47 Gyarmati et al. (2014). UPSKILL: A Credible Test of Workplace Literacy and Essential Skills Training. Social Research & Demonstration Corporation. https://www.srdc.org/media/199774/upskill-technical-report-en.pdf
48 Munro (2019) Skills, Training and Lifelong Learning (Ottawa: Public Policy Forum) https://ppforum.ca/publications/skills-training-and-lifelong-learning/
49 OECD. (2021). Training in Enterprises. New Evidence from 100 Case Studies, Getting Skills Right.
50 Innovation, Science and Economic Development Canada. (2021). Key Small Business Statistics – 2021. https://www.ic.gc.ca/eic/site/061.nsf/eng/h_03147.html#2.1
51 Bureau of Labor Statistics. (2021). Distribution of private sector employment by firm size class. https://www.bls.gov/web/cewbd/table_f.txt
52 Percival, Cozzarin, & Formaneck (2013). Return on investment for workplace training: the Canadian experience. International Journal of Training and Development, 17(1).
53 Innovation, Science and Economic Development Canada. (2021). Key Small Business Statistics – 2021. https://www.ic.gc.ca/eic/site/061.nsf/eng/h_03147.html#2.1
54 Bureau of Labor Statistics. (2021). Distribution of private sector employment by firm size class. https://www.bls.gov/web/cewbd/table_f.txt
55 Innovation, Science and Economic Development Canada. (2021). Key Small Business Statistics – 2021. https://www.ic.gc.ca/eic/site/061.nsf/eng/h_03147.html#2.1
56 Deloitte. (2022). Bright Ideas 2022. The future of Canada’s power and utilities sector. https://www2.deloitte.com/content/dam/Deloitte/ca/Documents/energy-resources/ca-en-energy-and-resources-pu-r-bright-ideas-report-aoda.pdf
57 Electricity Human Resources Canada. (2020). Work Transformed: The Impact of Technology.
58 Canada Labour Code (R.S.C., 1985, c. L-2) https://laws-lois.justice.gc.ca/eng/acts/L-2/page-15.html#h-341258
59 Alberta Occupational Health and Safety Act, SA 2020, c O-2.2 https://www.canlii.org/en/ab/laws/stat/sa-2020-c-o-2.2/latest/sa-2020-c-o-2.2.html
60 Newfoundland Occupational Health and Safety Act (O.C. 2012-005) https://assembly.nl.ca/legislation/sr/statutes/o03.htm
61 Vu, Lamb, Zafar. (2019) Who are Canada’s Tech Workers? The Brookfield Institute for Innovation + Entrepreneurship. https://brookfieldinstitute.ca/wp-content/uploads/FINAL-Tech-Workers-ONLINE.pdf
62 Innovation, Science and Economic Development Canada. (2021). Key Small Business Statistics – 2021. https://www.ic.gc.ca/eic/site/061.nsf/eng/h_03147.html#2.1
63 Statistics Canada. (2022). Trade union density rate, 1997-2021. https://www150.statcan.gc.ca/n1/pub/14-28-0001/2020001/article/00016-eng.htm
64 Statistics Canada Table 14-10-0355-01.
65 Bernard, Fell & Lin (2021). Fallout from the COVID-19 pandemic: A look back at selected industries in the service sector in 2020. Statistics Canada.
66 Lamb and Munro (2022) The pandemic forced Canadian business out of a tech lethargy. What happens next? (Ottawa: Policy Options) https://policyoptions.irpp.org/magazines/april-2022/the-pandemic-forced-canadian-business-out-of-a-tech-lethargy-what-happens-next/
67 Lamb and Munro (2022) Canada’s Digital Imperative: Enabling Innovation and Growth Through Technology Adoption (Shift Insights) https://www.shiftinsights.ca/projects/canada's-digital-imperative-
68 Ngoc Thang (2010). The relationship between training and firm performance: A literature review. Research and Practice in Human Resource Management, 18(1), 28-45.
69 Dostie (2013). Estimating the Returns to Firm-Sponsored On-the-Job and Classroom Training. Journal of Human Capital, 7(2).
70 Bessen (2015) Learning By Doing: The Real Connection Between Innovation, Wages, and Wealth (New Haven: Yale University Press).
71 Future Skills Centre, Diversity Institute & Environics Institute. (2020). Adapting to the Changing World of Work: Final Report from the 2020 Survey on Employment and Skills.
72 Cooke, Zeytinoglu & Chowhan (2009). Barriers to training access. Statistics Canada https://www150.statcan.gc.ca/n1/pub/75-001-x/2009107/article/10907-eng.htm
73 Future Skills Centre, Diversity Institute & Environics Institute. (2020). Adapting to the Changing World of Work: Final Report from the 2020 Survey on Employment and Skills.
74 Dostie & Montmarquette (2007). Employer-Sponsored Training in Canada: Synthesis of the Literature using Data from the Workplace and Employee Survey. Human Resources and Social Development Canada.
75 OECD. (2021). Training in Enterprises. New Evidence from 100 Case Studies, Getting Skills Right.
76 Government of Manitoba, August 9, 2022 [Press Release] https://news.gov.mb.ca/news/index.html?item=55797&posted=2022-08-09
77 Canada Job Grant (CJG). Mentor Works. Retrieved from: https://www.mentorworks.ca/government-funding/human-resources-and-training/canada-job-grant-cjg/
78 Goss Gilroy Inc. (2016). Canada Job Grant 2-Year Review. Retrieved from: https://flmm-fmmt.ca/wp-content/uploads/2021/07/CJG-Year-Two-Review-Final-Report-EN-1.pdf
79 Canada Job Grant (CJG). Mentor Works. Retrieved from: https://www.mentorworks.ca/government-funding/human-resources-and-training/canada-job-grant-cjg/
80 Goss Gilroy Inc. (2016). Canada Job Grant 2-Year Review. Retrieved from: https://flmm-fmmt.ca/wp-content/uploads/2021/07/CJG-Year-Two-Review-Final-Report-EN-1.pdf
81 Ibid.
82 Revenu Quebec. Contribution to the Workforce Skills Development and Recognition Fund. https://www.revenuquebec.ca/en/businesses/source-deductions-and-employer-contributions/calculating-source-deductions-and-employer-contributions/contribution-to-the-workforce-skills-development-and-recognition-fund/
83 Gagnon & Smith (2013). The Effects of a Training Levy on Training Characteristics and Outcomes: The Case of Quebec
84 Québec (2019). Loi favorisant le développement et la reconnaissance des compétences de la main-d’œuvre: RAPPORT QUINQUENNAL 2013-2018. & Québec (2019). Loi favorisant le développement et la reconnaissance des compétences de la main-d’œuvre: Rapport sur les activités de formation déclarées en 201 conformément à l’article 3 du règlement sur les dépenses de formation admissibles.
85 Bélanger and Robitaille (2008). A Portrait of Work-Related Learning in Quebec. http://en.copian.ca/library/research/ccl/quebec/quebec.pdf
86 Gagnon & Smith (2013). The Effects of a Training Levy on Training Characteristics and Outcomes: The Case of Quebec.
87 Ibid.