Chart of the Month - October 2019
Percentage of part-time workers with and without post- secondary education in Canada by gender, 1990-2018
Source: Labour Force Survey Table PID 14-10-0020-01
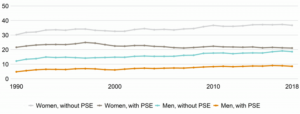
Chart of the Month - September 2019
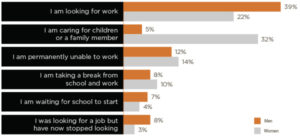
Men and women tend to have different reason for being NEET
Main activity while not in employment, education or training by gender (% of respondents)
Chart of the Month - August 2019
Share of Canadiands looking for infomration related to the skill requirements of jobs (%)
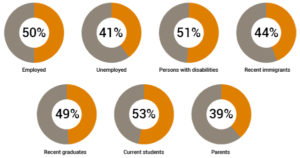
Chart of the Month - July 2019
Figure 1: Higher Vacancies Estimation with JVWS and CFIB than SEPH
Job vacancy estimates from SEPH[1], JVWS and CFIB for 2015 Q2 to 2019 Q1
Source: Survey of Employment, Payrolls and Hours, Statistics Canada, table 14-10-0224; Job Vacancy and Wage Survey, Statistics Canada, table 14-10-0325-01; Help Wanted Private sector job vacancies, Canadian Federation of Independent Business, available here
Note 1: Since SEPH is a monthly estimator, the average of monthly estimates of job vacancies for the quarter are presented.
Chart of the Month - June 2019
Share of employers, by sector, reporting that finding qualified or skilled workers is a human resource challenge (%)
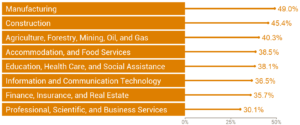
Chart of the Month - May 2019
Top 5 HR challenges for Canadian Employers
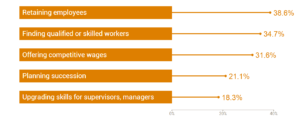
Chart of the Month - April 2019
Average hourly wages by relative qualifications held: Education level of workers versus level required by occupation
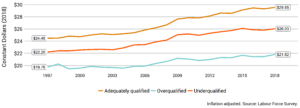
Chart of the Month - March 2019
Chart of the Month - January 2019
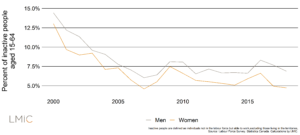
The proportion of inactive people who report not working because there are no jobs or believe they don't have the right skills.
Chart of the Month - December 2018
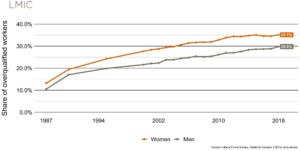
Over-qualification Rates among Employed Canadian Men and Women
Chart of the Month - November 2018
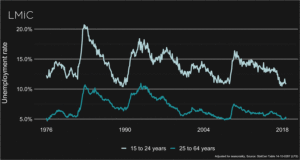
Unemployment rated by age group
