
What NEET and NEETEST tell us about Canada’s Youth Labour Market
Author
Ken Chatoor, Director of Research and Strategic Foresight at Labour Market Information Council
Youth across Canada have been struggling with high unemployment and long-term unemployment rates. As high unemployment lingers, researchers and policymakers are trying to understand where interventions are most needed. One way labour market researchers do this is by looking at a measure called “not in employment, education or training”, or NEET, to better understand youth who are disengaged from the labour market.
NEET adds nuance to the unemployment rate by accounting for circumstances like school or training. But NEET also has a few caveats. First, it’s a “snapshot” measure, meaning it does not tell us how long someone has been out of work or school. Second, it does not account for those in caretaking positions, such as unpaid roles caring for a loved one. To add this context, Statistics Canada researchers developed a new measure called NEETEST.
NEETEST (not in employment, education or training, excluding short transitions) accounts for both caretaking roles and long-term unemployment. Developed by Statistics Canada researchers Marc Frenette and Tomasz Handler, NEETEST leverages data linkages and clever use of administrative data. Their findings reveal new insights that raise challenging questions about Canada’s youth labour market.
In this blog, we look at what NEET and NEETEST can tell us and how new data linkages can address gaps in traditional measures. Together, NEET and NEETEST offer an interesting example of how policy needs can shape LMI and vice versa.
What is NEET?
What we know today as NEET emerged in the United Kingdom amid concerns about youth who were least engaged with the labour market and education. Policymakers around the world began to recognize the value of this more precise approach to understanding youth labour market dynamics. By the 2010’s, NEET was appearing in Canadian research and policy.
NEET is a particularly useful construct in labour and education policy to assess the state of Canada’s youth labour market. This is because it gives policymakers a tool to understand how many unemployed people are entrenched in the most challenging unemployment situations, rather than just generally being “unemployed”.
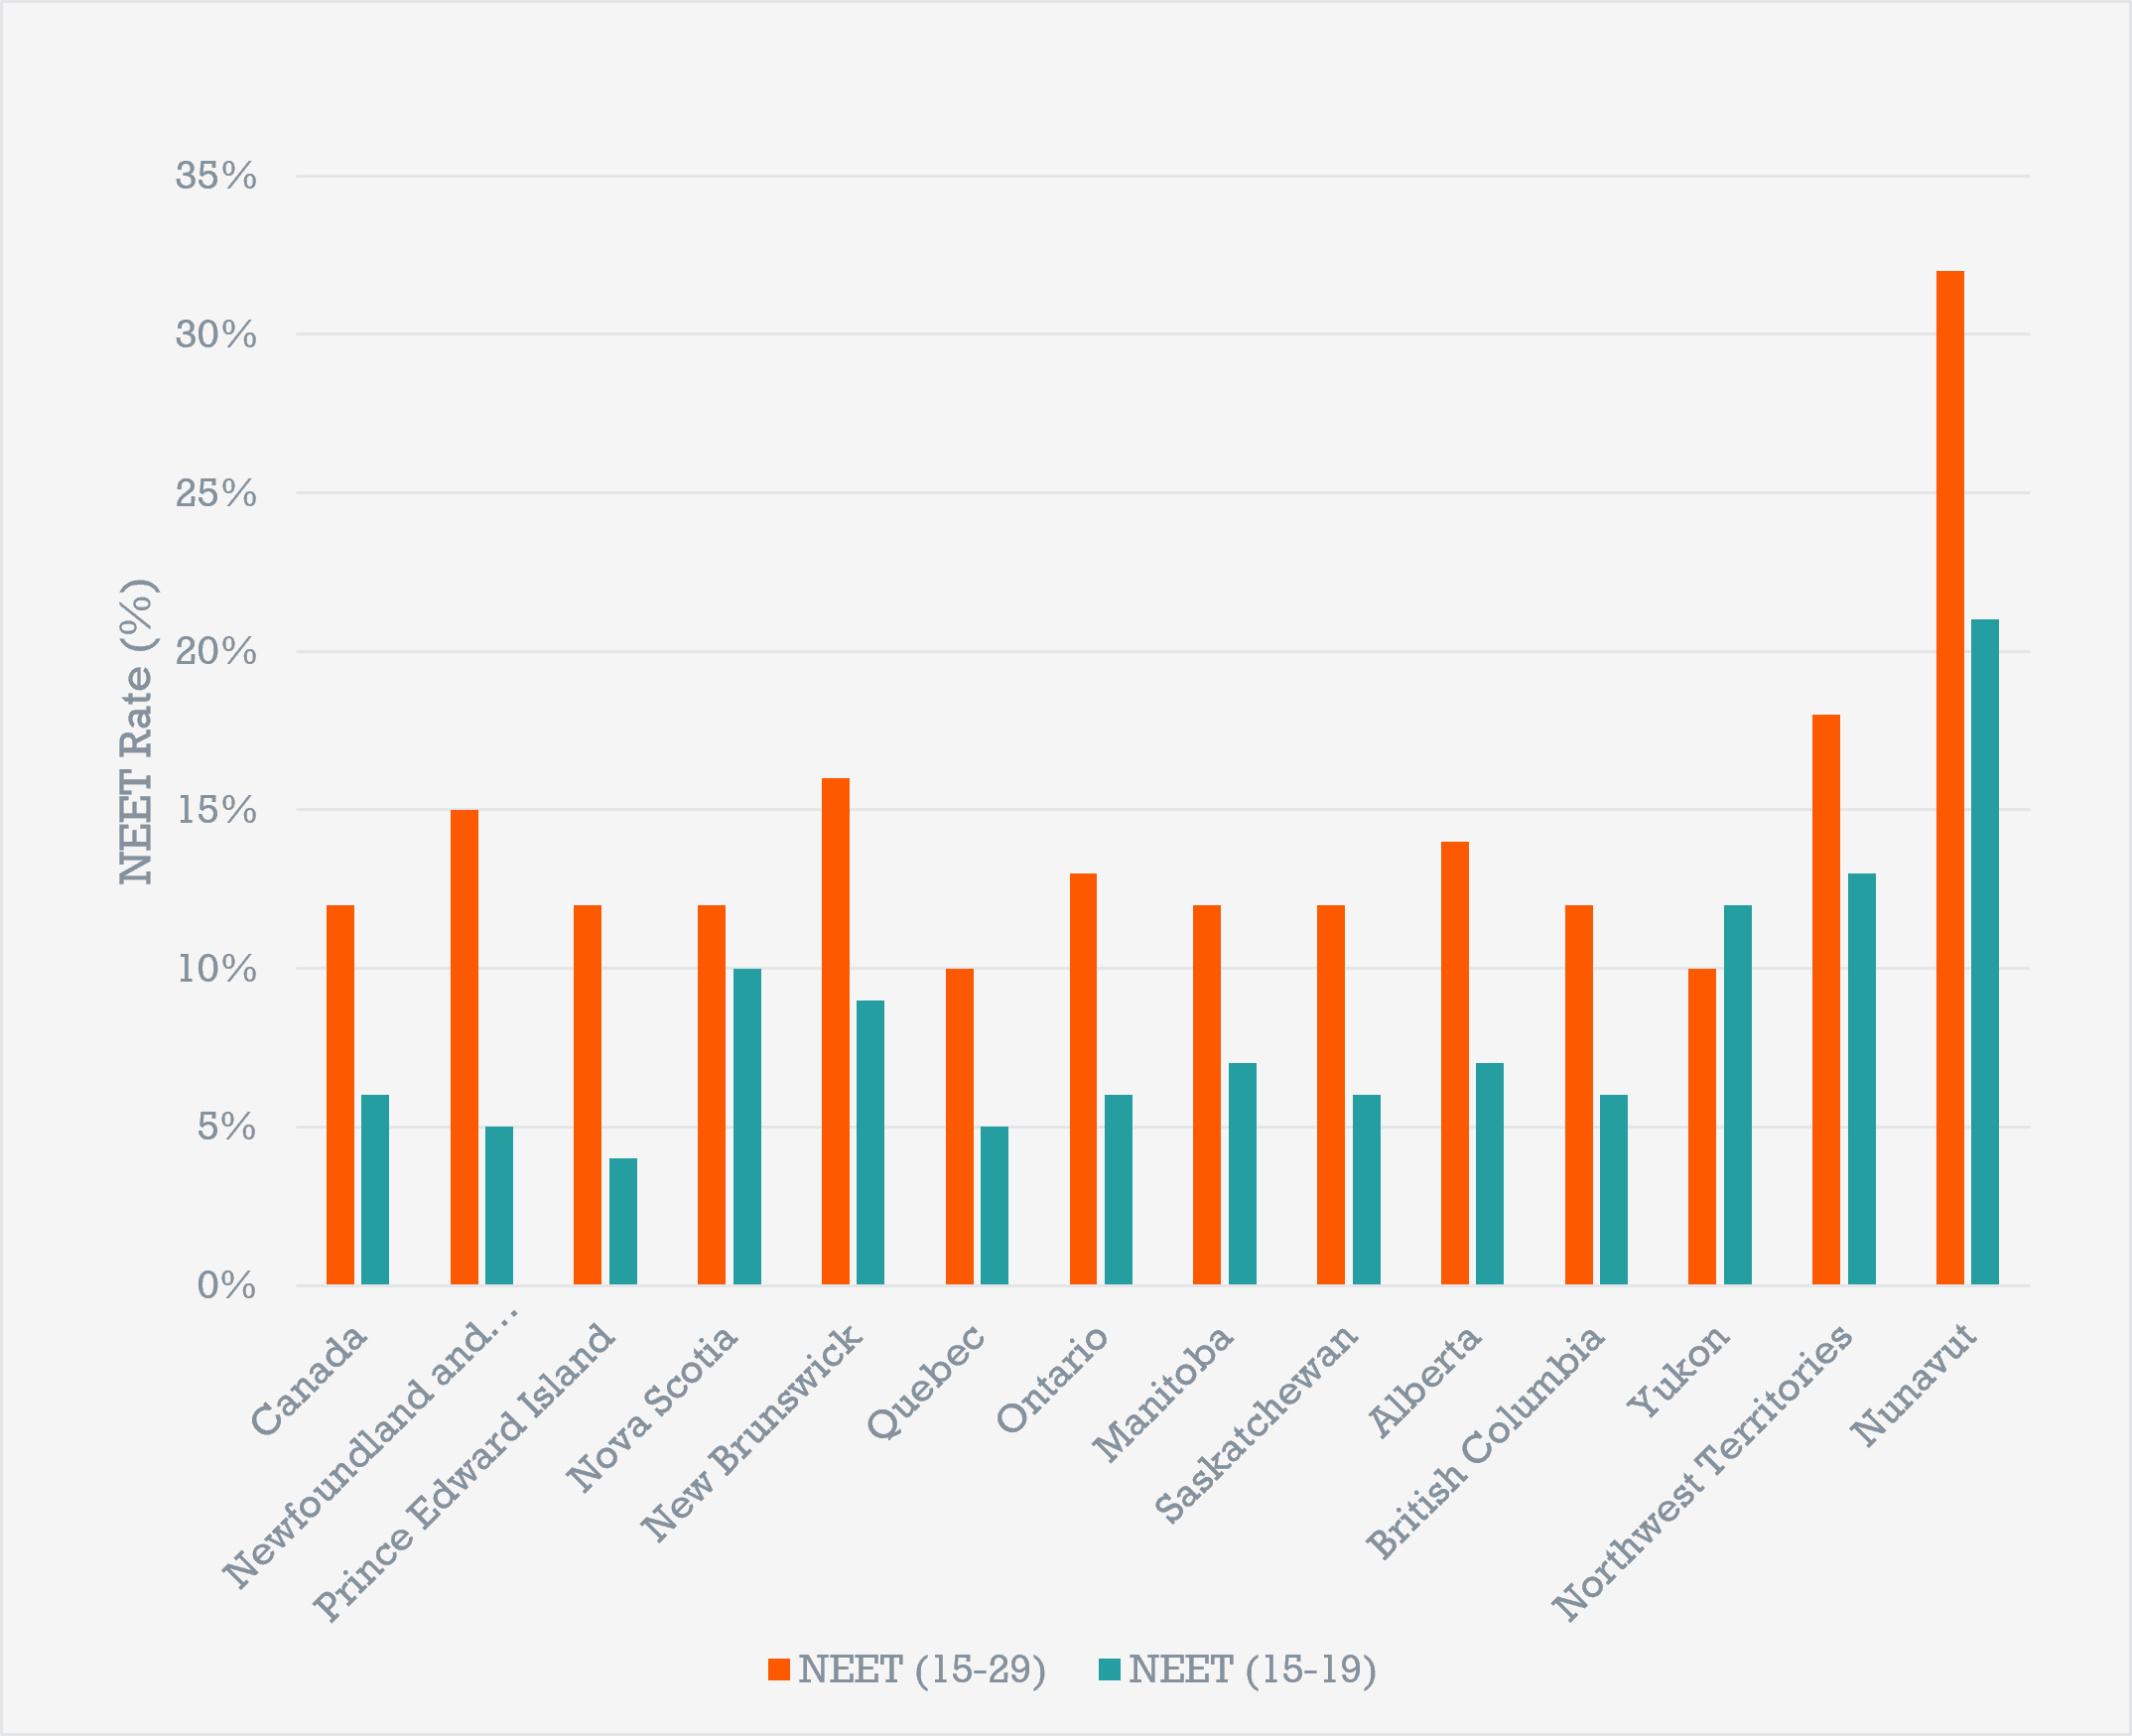
To put this into practice, let’s start by looking at NEET rates by age and jurisdiction based on 2025 data from Statistics Canada. Immediately, we see a highly variable pan-Canadian picture. Among 15–29-year-olds, NEET rates range from 10% in Quebec to 32% in Nunavut. Alberta (15%) and New Brunswick (16%) also have NEET rates above the Canadian average (12%).
Many factors could contribute to this regional variation, including unique local economies and jurisdictional differences in social and economic policies. Understanding the local, cultural, and economic context behind these differences can help policymakers make decisions specific to their communities.
Looking at 15–29-year-olds is a useful starting point, but this age range spans very different life stages, which can make interpretation difficult. Looking separately at 15–19-year-olds can provide additional context because many in this age group are mostly still in school, dependent on family, or transitioning from high school to postsecondary education or into the labour market. A high NEET rate in this younger group may therefore warrant closer attention.
A few high-level observations among the 15–19-year-old group are worth noting. First, NEET rates vary considerably across Canada. In general, however, the highest NEET rates among 15–19-year-olds are in the territories. Second, jurisdictions with higher NEET rates among 15–29-year-olds do not necessarily have proportionally higher rates among 15–19-year-olds.
For example, Yukon is the only province or territory where the NEET rate for 15–19-year-olds is higher than the broader 15–29-year-old group. Another curious observation involves two neighbouring provinces, PEI and Nova Scotia. Both have near-identical NEET rates for 15–29-year-olds (12%), but Nova Scotia's NEET rate for 15–19-year-olds is 2.5 times higher than PEI's.
These differences likely stem from a myriad of social and economic factors unique to each local labour market. This means policymakers should always consider both age groups within their jurisdiction. Understanding this in the context of these numbers can help inform more targeted policy responses.
Figure 1. NEET rates vary considerably by age and jurisdiction across Canada in 2025.
NEET = not in employment, education, or training.
Source: Statistics Canada. Table 37-10-0196-01
What is NEETEST?
Not long after its wider adoption across the OECD, NEET faced criticism from policymakers and academics who worried its caveats risked overly broad interpretation. The first caveat was time. Most measures of NEET are a “snapshot,” meaning they can only tell us whether a person was unemployed at a particular moment, not how long they were unemployed.
The second caveat was accounting for those in personal caregiving situations. With most OECD populations facing rapidly aging populations, youth taking on caregiving responsibilities in lieu of school or work is not an arbitrary factor. This is where the NEETEST construct steps in.
One challenge is that no single data source captures both long-term labour market activity and caregiving. To overcome this, Frenette and Handler linked the T1 Family File (T1FF), the Longitudinal Worker File (a combination of T1 files, T4 files, Record of Employment files and the Longitudinal Employment Analysis Program) and the Postsecondary Student Information System (PSIS).
Once the linkages were complete, they set a series of parameters to narrow down to NEETEST. To qualify for NEETEST, individuals must have the following characteristics during a full calendar year:
- They did not work
- They were not at school
- They did not provide care for others
Due to the unique life circumstances of 15–29-year-olds described earlier, the researchers focused on 20–29-year-olds. Other limitations in the Labour Force Survey meant only provincial data were available.
So what did their analyses show?
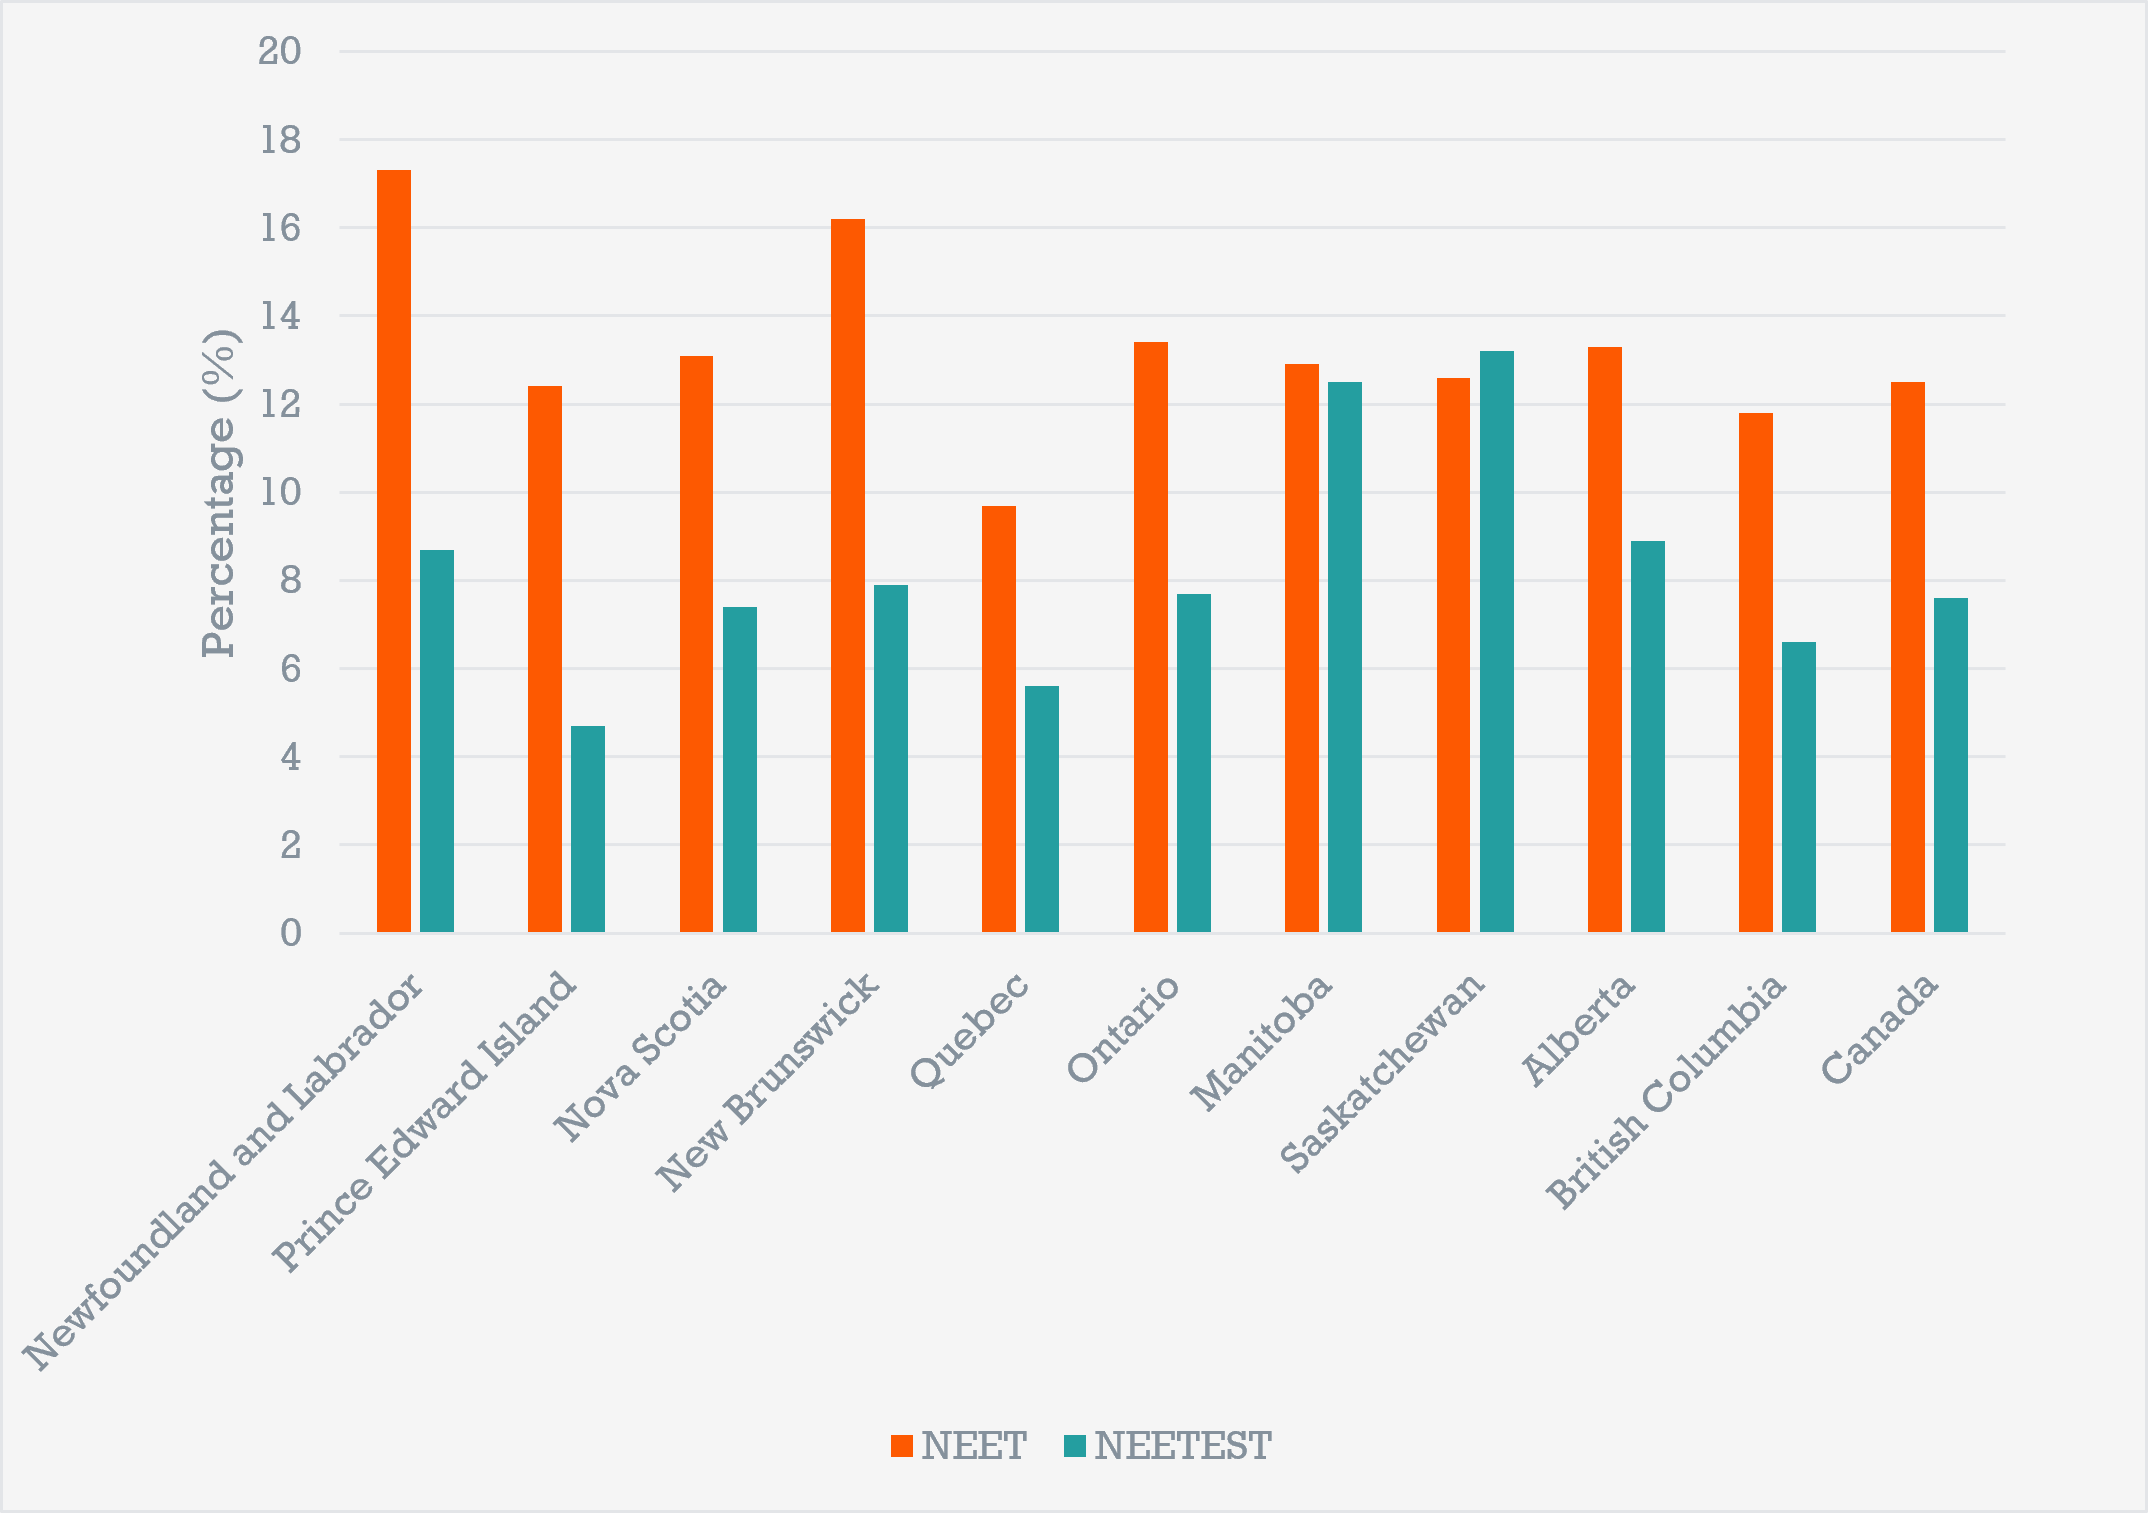
In 2022, the most recent year available for NEETEST analyses, the average Canadian NEET rate was 12.5%, and the average NEETEST rate was 7.6%. Across Canada, there were very wide variability in NEET and NEETEST rates – confirming that national numbers should not be assumed to reflect individual jurisdictions. For example. NEETEST rates were as low as 4.7% in PEI, and as high as 13.2% in Saskatchewan.
Interestingly, despite having NEET rates close to the national average, Saskatchewan and Manitoba had the highest NEETEST rates in Canada. Several Atlantic provinces show the opposite pattern: NEET rates are above the national average, but NEETEST rates are often slightly below it. This means you should always look at NEET and NEETEST rates separately as there is not a clear pattern or relationship between the two.
The reasons for these unique regional patterns warrant further study, particularly in Saskatchewan and Manitoba, where NEETEST rates are nearly the same as NEET rates. This could be due to many factors, and further research could help elucidate why and point to possible interventions specific to that region of Canada.
Figure 2. NEET and NEETEST rates show different patterns across provinces
Notes: Data are for youth aged 20-29 in 2022. NEET = not in employment, education or training; NEETEST = not in employment, education or training, excluding short transitions.
Sources: Statistics Canada, Labour Force Survey (NEET), and T1 Family File, Longitudinal Worker File, Postsecondary Student Information System, and 2021 Census of Population (NEETEST).
Frenette and Handler, Statistics Canada, 2026
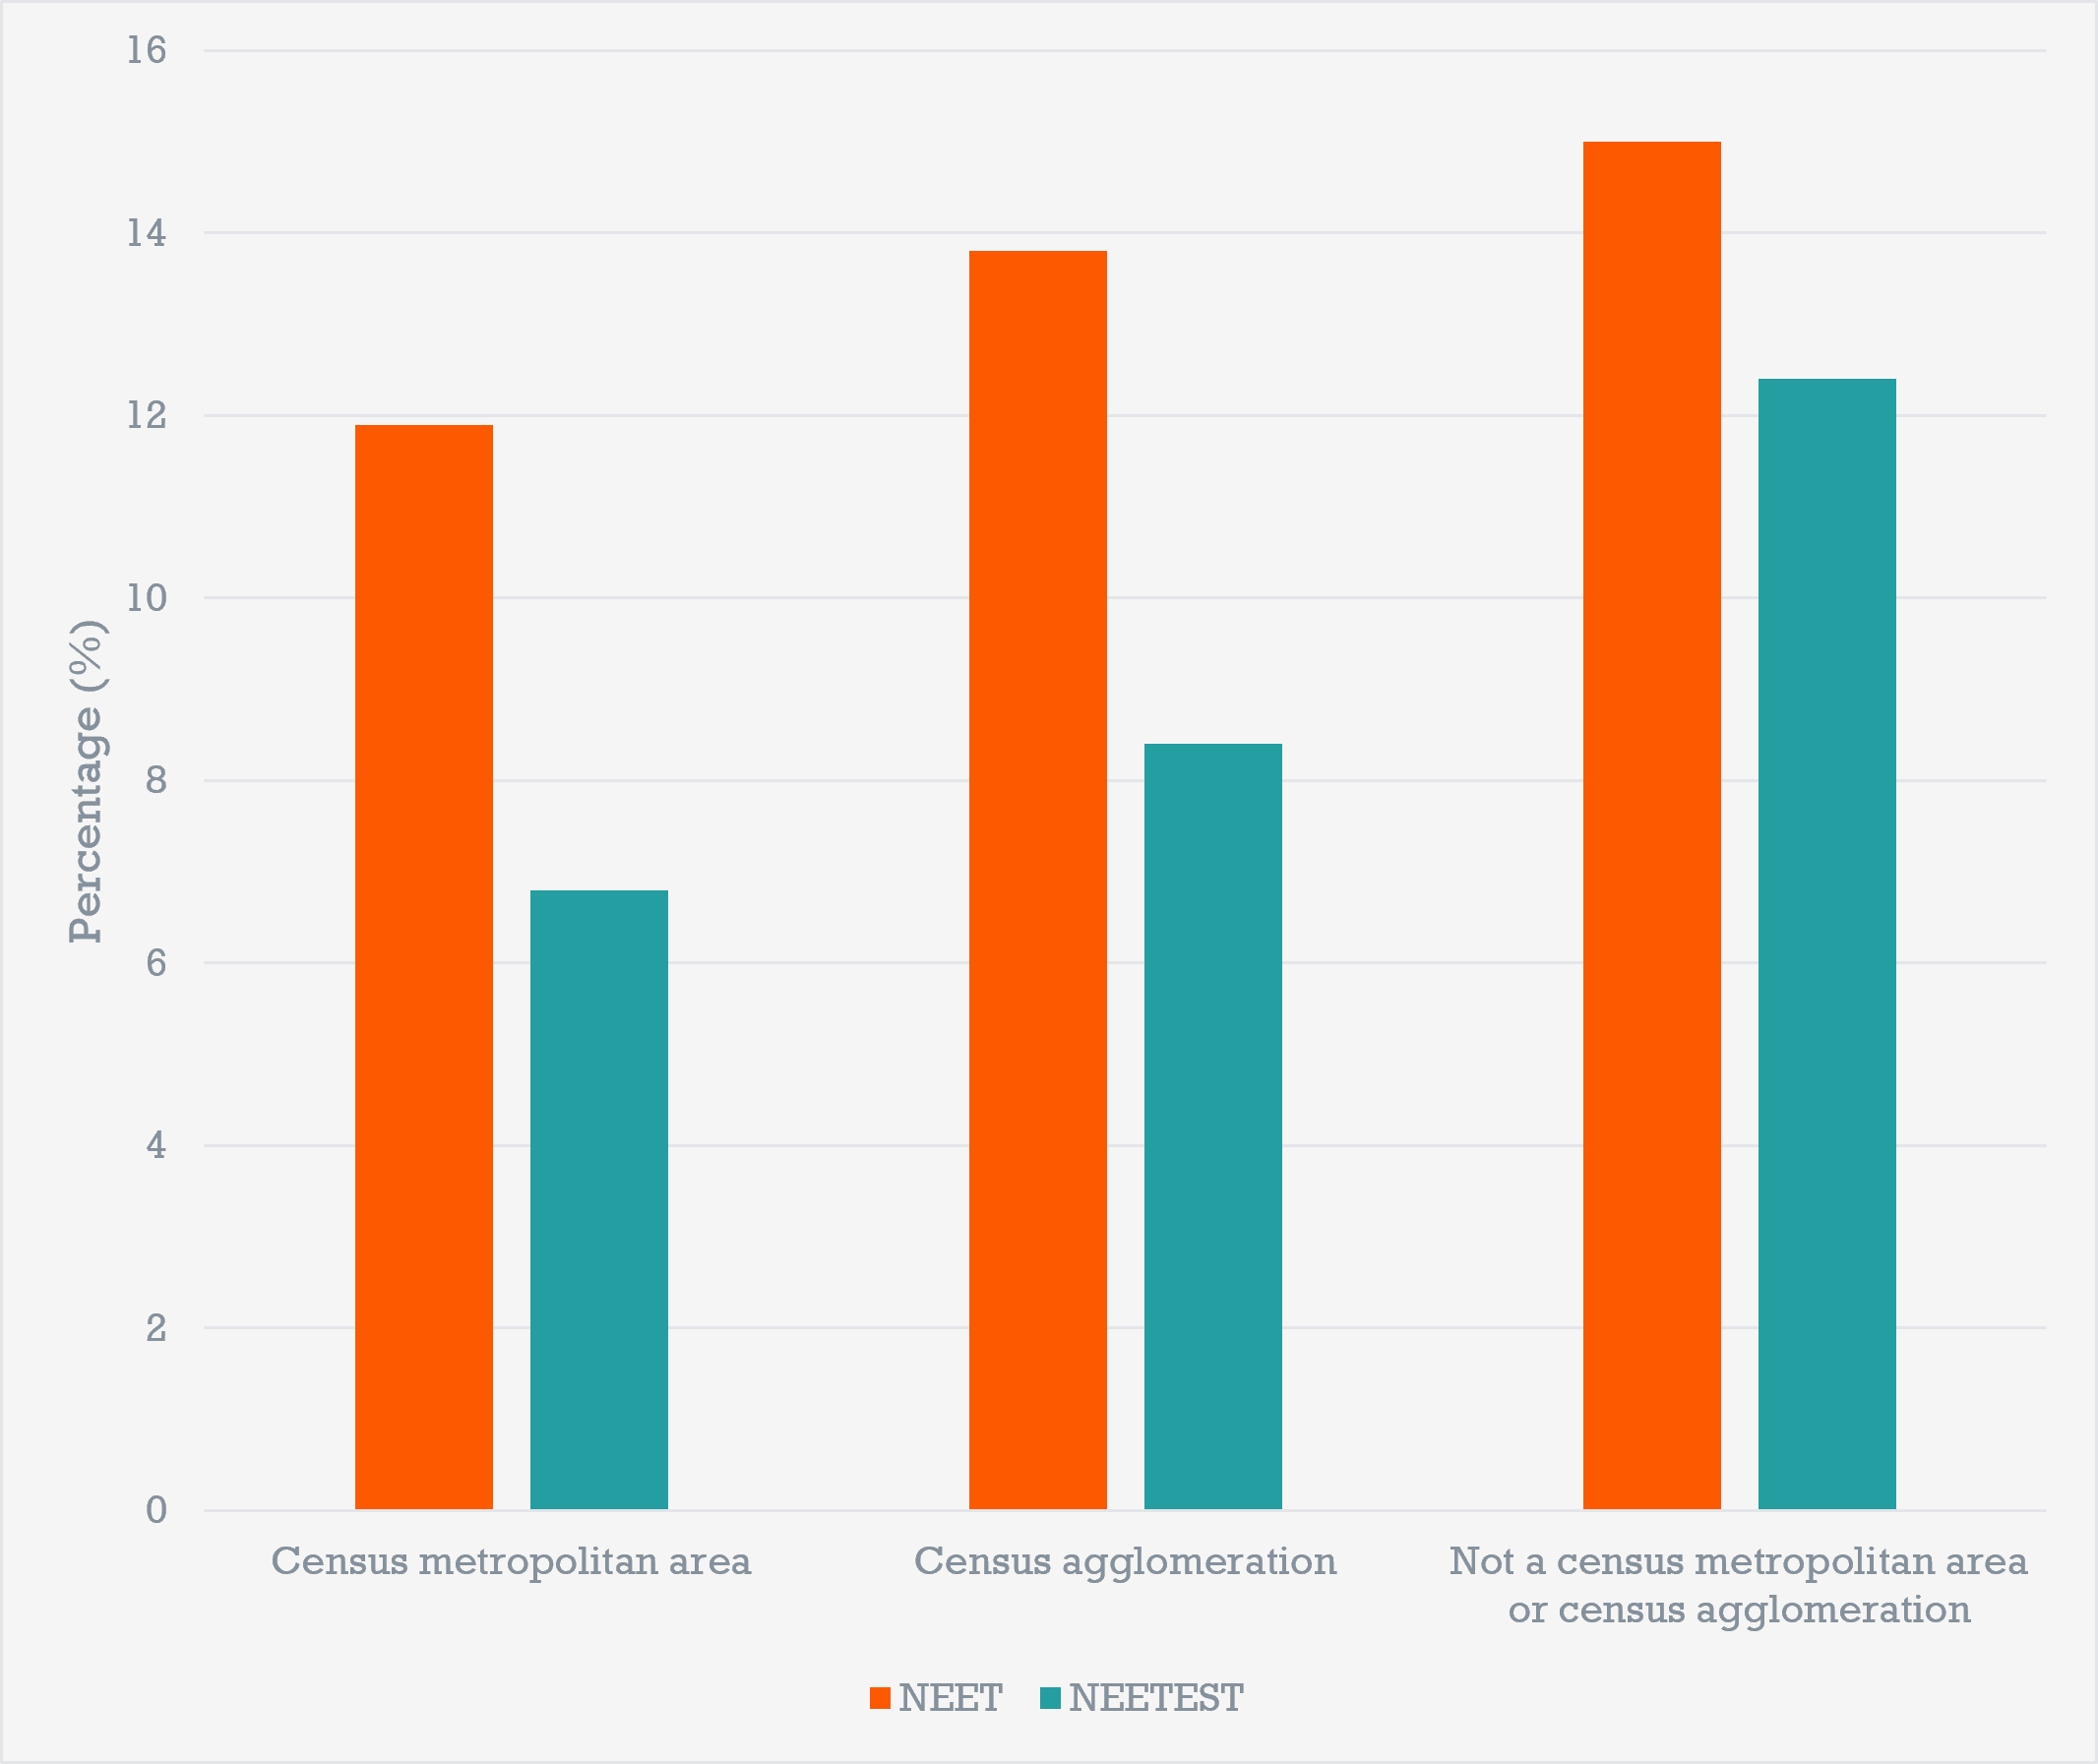
The next figure looks at how NEET and NEETEST rates vary by geography. Both rates increase outside larger population centres, with the highest rates among youth living outside census metropolitan areas. The difference is particularly pronounced for NEETEST. This offers a helpful path for policymakers to follow for more targeted analyses and crafting policy solutions. Breaking this down by individual jurisdictions could reveal where NEETEST numbers are highest within a jurisdiction, and whether this pattern holds true across all provinces in Canada.
Figure 3. NEETEST rates are highest outside census metropolitan areas and census agglomerations
Notes: NEET = not in employment, education or training; NEETEST = not in employment, education or training, excluding short transitions.
Sources: Statistics Canada, Labour Force Survey (NEET), and T1 Family File, Longitudinal Worker File, Postsecondary Student Information System, and 2021 Census of Population (NEETEST).
Frenette and Handler, Statistics Canada, 2026
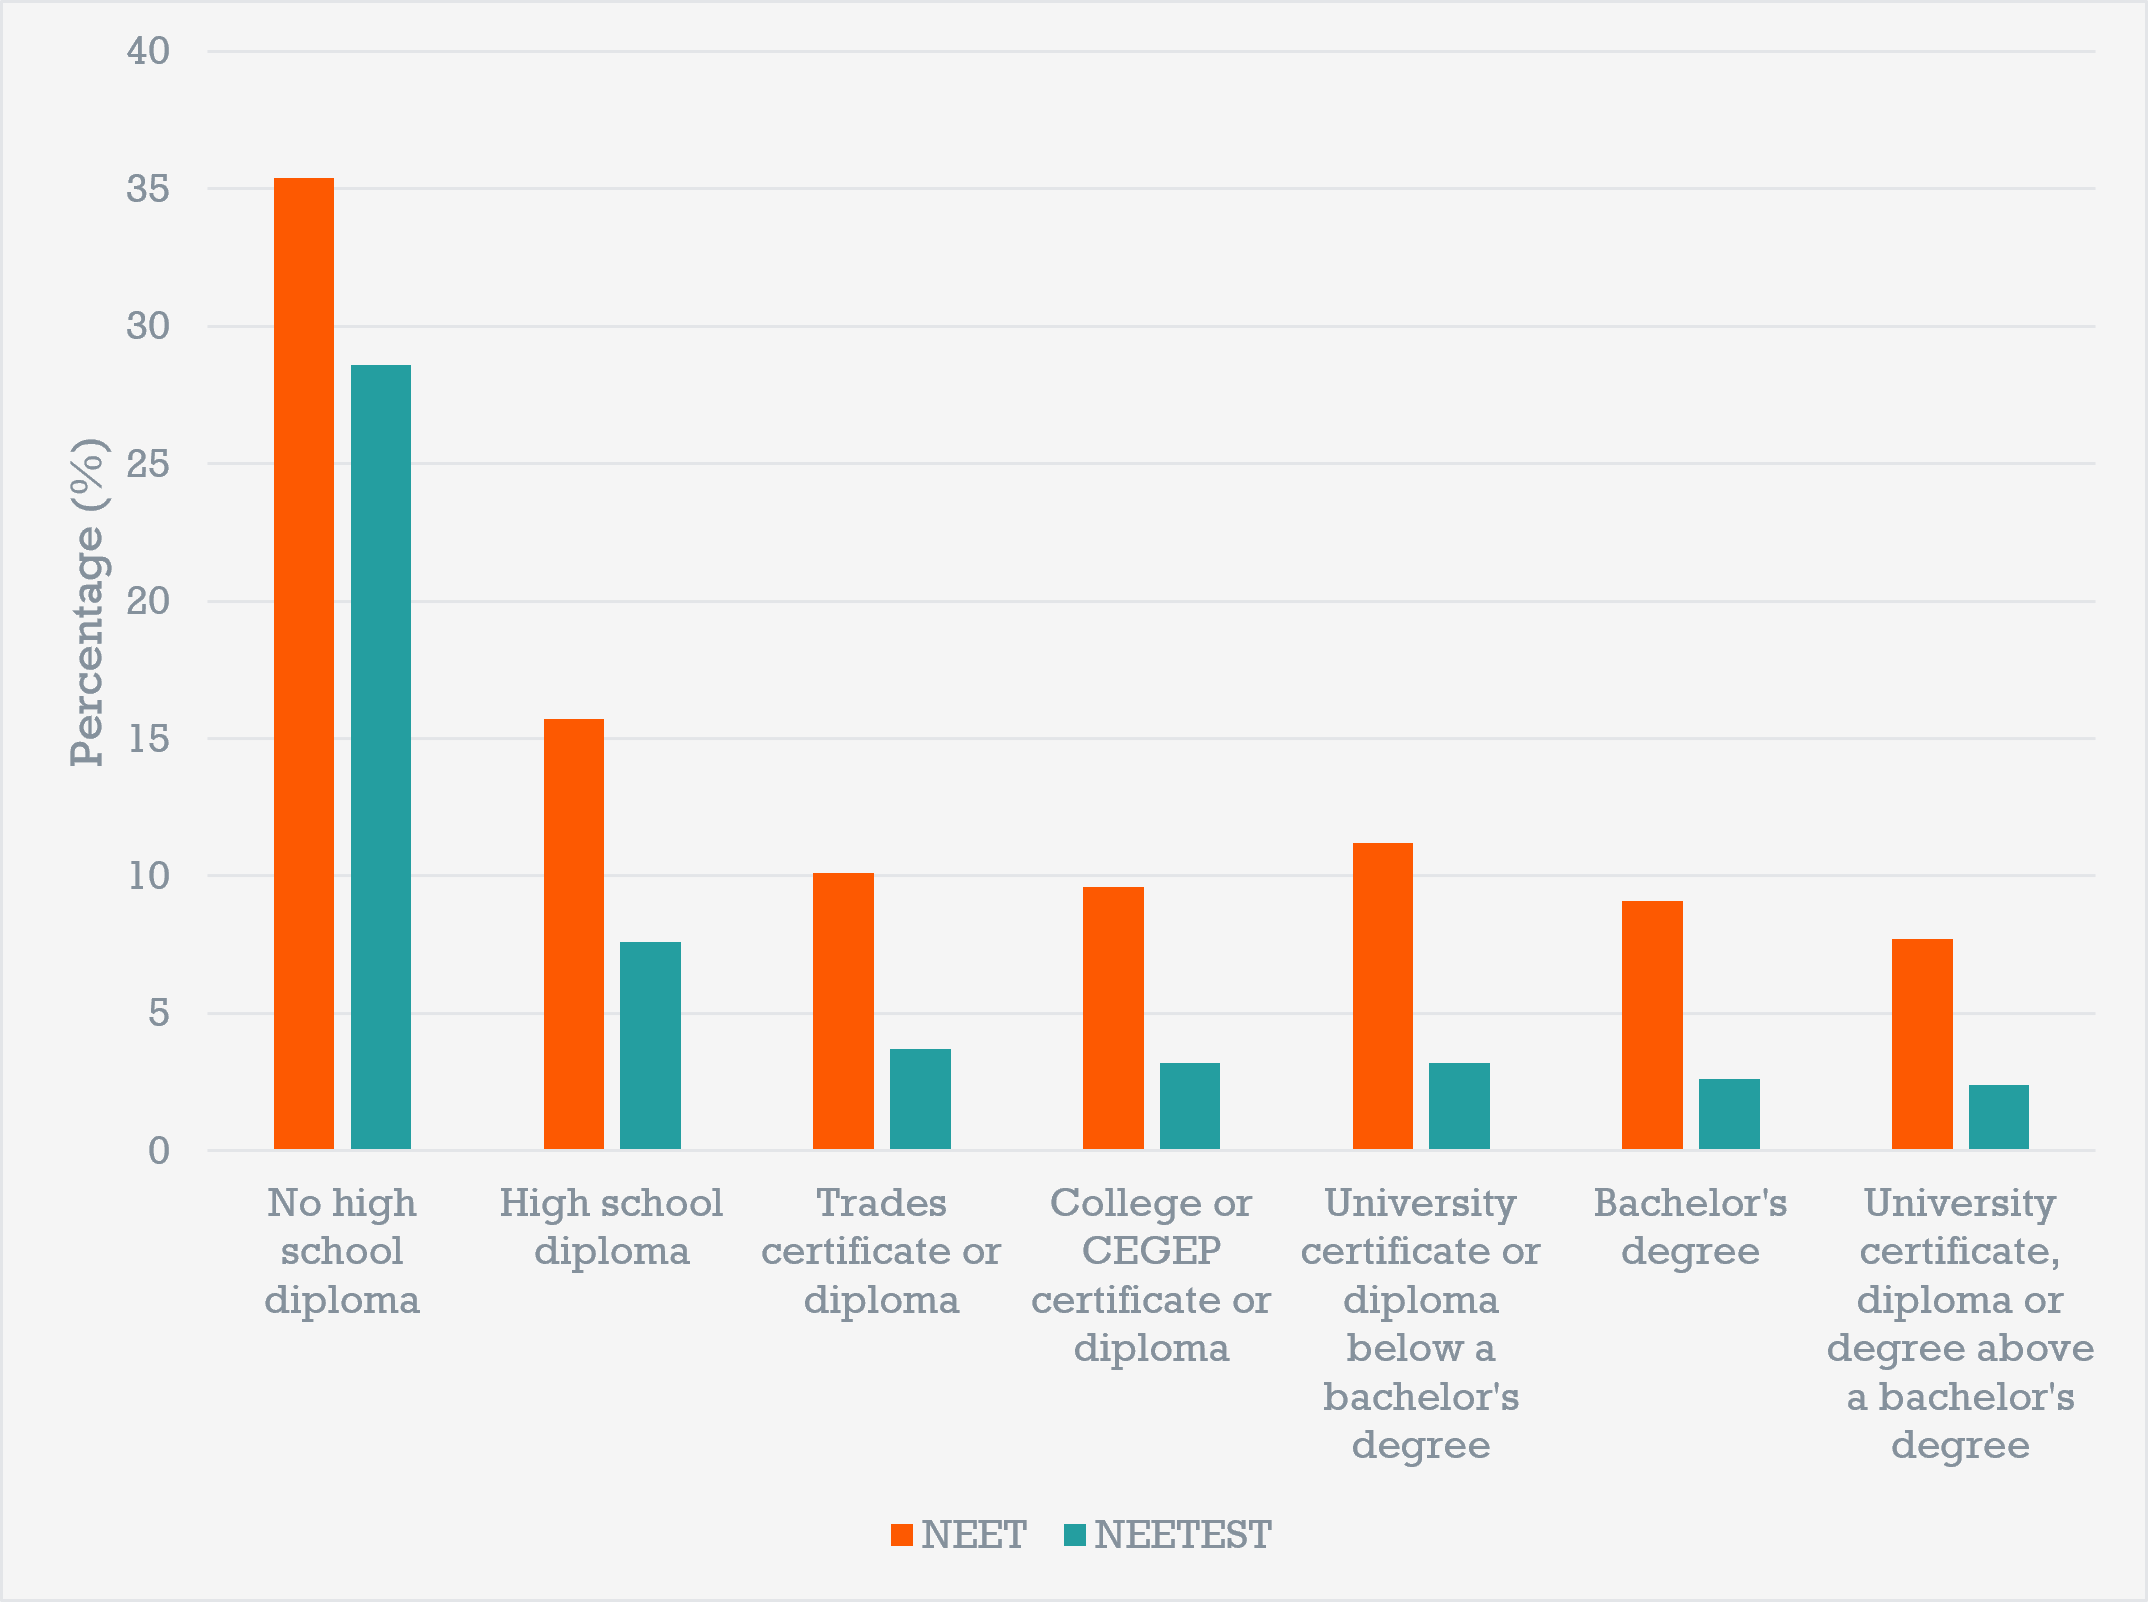
Geography can show where NEETEST rates are highest, but other characteristics, like education credential attainment, can tell us more about who is most likely to be NEETEST. Here, we observe some of the largest differences so far. In general, any form of post-secondary education is associated with much lower rates of both NEET and NEETEST, with the lowest rates of NEETEST occurring for those with a credential above a bachelor’s degree (2.4%). Those with a high school diploma have NEETEST rates of 7.6%, more than double the highest NEETEST rate of any PSE credential, trades certificates at 3.7%. By far, the group with the highest NEET and NEETEST rates is those without a high school diploma, with rates of 35.4% and 28.6%, respectively. Taken together, these results show the positive impact of having any postsecondary credential.
Taken together with geography and jurisdiction, these results raise questions about how different factors interact with or influence each other. Understanding those relationships could provide a more detailed picture of who experiences NEETEST which could help policymakers identify where more targeted interventions may be needed.
Figure 4. NEET and NEETEST rates are lower among youth with higher levels of education
Notes: NEET = not in employment, education or training; NEETEST = not in employment, education or training, excluding short transitions.
Sources: Statistics Canada, Labour Force Survey (NEET), and T1 Family File, Longitudinal Worker File, Postsecondary Student Information System, and 2021 Census of Population (NEETEST).
Frenette and Handler, Statistics Canada, 2026
Like any LMI construct, NEETEST comes with some trade-offs. The datasets used to calculate NEETEST are not publicly available are require complex linkages, which means researchers need access to Statistics Canada and the technical expertise to conduct linkages and analyses. Secondly, due to the nature of how and when some of those datasets are collected, current measures of NEETEST will lag behind the most up-to-date, regularly updated data. As data linkages become more streamlined and researchers become more familiar with NEETEST, these caveats may gradually lessen.
What this means for the Canadian labour market
Besides demonstrating the power of linking datasets, NEETEST speaks to current and emerging issues that require careful monitoring, including youth unemployment and Canada’s aging population. In Canada, long-term youth unemployment remains elevated at multi-decade highs. This has coincided with depressed youth labour market participation rates. It is well demonstrated that youth experiencing unemployment today can have long-term scarring effects.
Looking longer term, Canada’s aging population will change the composition of the labour market and the expectations for young Canadians who increasingly find themselves “sandwiched” between the needs of aging loved ones and their own personal and family responsibilities. The NEETEST construct helps us better account for lived realities that are, and will continue to be, shaping the labour market.
Early NEETEST findings already raise questions worth investigating.
- Why don’t NEET and NEETEST numbers always correlate across Canada, and what might that tell us about individual jurisdictions?
- Why do rural parts of Canada experience significantly higher levels of NEET and especially NEETEST compared to more urbanized regions?
- What are the unique policy, cultural and economic factors that are driving some of the trends we observe between men and women?
- How might other demographic factors, like race and family income, impact NEET and NEETEST?
These questions will likely require inferential analyses, multidisciplinary approaches, and jurisdictional perspectives, using qualitative and quantitative methods to answer them. To that end, Frenette and Handler followed up with a report looking at the impact of sociodemographic factors on NEETEST status. They identified several groups of Canadians at higher risk of experiencing NEETEST, offering more avenues for researchers and policymakers to explore.
Statistics Canada’s work proves we can ask deeper, more complex questions through data linkages and careful consideration of the real-life factors that impact people’s ability to participate in the labour market. At LMIC, we’re continuing to engage with PSE’s, Chambers of Commerce, the Forum of Labour Market Ministers, and our colleagues at Statistics Canada to better understand how LMI can improve policy responses.
To learn more about NEETEST and the methodology behind it, read Marc Frenette and Tomasz Handler’s Statistics Canada research, The NEETEST youth: Not in employment, education, or training, excluding short transitions.