Table of Contents
Key Findings
- Information on salaries/wages, skill requirements and job benefits are the most soughtafter types of labour market information.
- Friends and family, job advertisement websites and social media are the most common sources of labour market information.
- Across the board, Canadians report that labour market information is outdated, is not relevant to their situations and does not provide needed insights about the future.
- Empirical research finds some differences in these preferences across groups:
- Age: people aged 55 and over indicate less of a need for wage and benefit information than younger groups; young people are more concerned than older people about the challenges and shortcomings of available labour market information.
- Income: people with higher household income are more likely to seek out information on salary and benefits; those with lower income typically need more information related to the cost of living, job openings and where to get training.
- Gender: both women and men look for similar types of information, but women are more likely to report seeking this information.
Introduction
To better understand how Canadians use and evaluate labour market information (LMI) and what they find lacking in the current system, the Labour Market Information Council (LMIC) conducted public opinion research surveys of nine different user groups (see Box 1). This report includes the findings of seven of these surveys: 1) employed persons, 2) unemployed persons, 3) persons with disabilities, 4) recent immigrants, 5) recent graduates, 6) current students and 7) parents. Across these seven surveys, we identify Canadians’ most common LMI needs and challenges in using LMI, as well as their primary sources for accessing LMI. The highlevel findings from these surveys are available via our LMI interactive dashboard and a series of LMI Insight Reports (see Box 2).
Confirming our earlier findings (LMIC, 2019d), we show that information on wages/salaries, skill requirements and job benefits are the most sought-after LMI needs. However, we find interesting differences across age group, gender and income-level breakdowns. For example, half (51%) of those with household incomes below $20,000 report looking for wage or salary information, and only 28% say they look for information on benefits. At the other end of the income spectrum, two-thirds (65%) of respondents with household incomes above $100,000 seek out salary information and 44% say they look for information related to benefits.
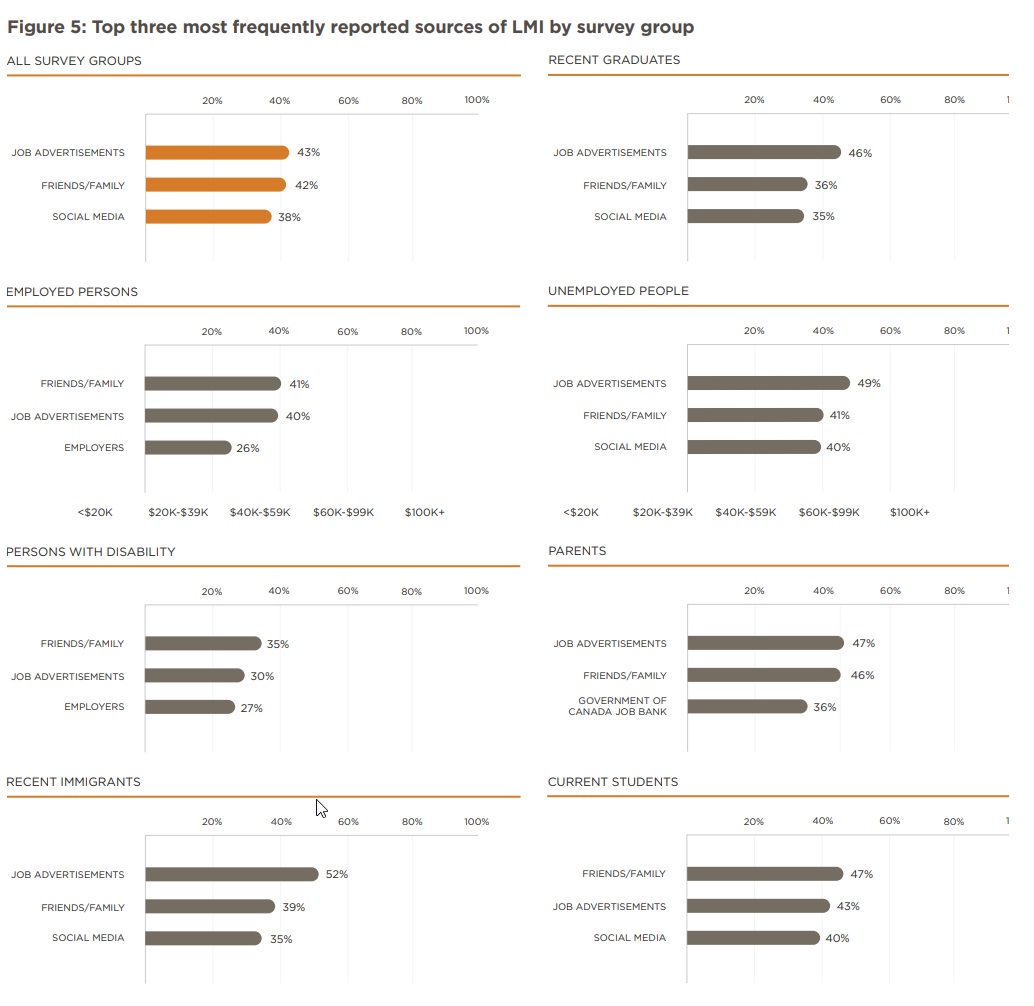
Our findings also show that friends/family are the most common source of LMI, typically followed by job advertisement websites and social media. Young people are more likely to use job websites and social media than older people. Using social media to find LMI, for instance, is significantly lower among those 55 and older (21%) compared to those aged 18–24 (35%).
The most frequent challenges faced when looking for LMI are also discussed in this report. Respondents say that available LMI is outdated and irrelevant to their situations. They also report that it offers them no insights about the future (see LMIC, 2019e). Young people are more concerned about these challenges than older people.
Our results reveal a need for improving the type of LMI produced in Canada. Making it more comprehensively focused on the needs identified by different user groups would be helpful. Further, the fact that so many Canadians continue to rely on informal channels for LMI suggests that distribution channels need to be vastly improved.
Box 1: Survey Questionnaires
We partnered with Forum Research to conduct surveys of Canadians on their use and assessment of LMI. In total, nine independent surveys of individuals were conducted, each targeting a specific user group: 1) employed persons, 2) unemployed persons, 3) persons with disabilities, 4) recent immigrants, 5) recent graduates, 6) current college and university students, 7) parents, 8) employers and 9) career practitioners. We asked a similar set of questions across the first seven survey groups, although the questions were sometimes worded differently to tailor each survey to its target group. Note that findings on the two distinct surveys targeting employers and career practitioners are not covered in this report.
In addition, we asked specific questions unique to each group’s circumstances. The results from these specific questions have been discussed in detail in our Insight Reports on students and parents (LMIC, 2019f), recent immigrants (LMIC, 2019j) and persons with disabilities (LMIC, 2020). We also conducted a survey on youth who are not in employment, education or training (NEET; LMIC, 2019i) to understand how they use and evaluate LMI.
Respondents were contacted through a mixed methodology, combining random digit dial telephone interviews and online surveys. The mixed methodology provided respondents with a flexible approach for completing the survey and ensured that all potential respondents had a fair and accessible chance to participate in the study
The sample design applied quotas to ensure representativeness for all provinces and territories. After collection, the data were weighted by age, gender and urban/rural location to replicate the population distributions found by the 2016 Census. In the territories, due to the lack of appropriate census data, demographic population characteristics were derived from municipal or territorial data sources.
Related Literature
The existing literature on how people use LMI is mostly focused on evaluating the impact of a specific piece of information on outcomes such as the field of study chosen, whether further training is undertaken or other career-related decisions. Our study contributes to this literature by examining Canadians’ use of the existing LMI system.
Although our focus differs somewhat from the existing literature, similar patterns are observed in both areas. For example, research by Wiswall and Zafar (2014), Ruder and Noy (2017), and Beffy, Fougere, and Maurel (2012) all suggest that expectations of future earnings have an important impact on choosing a major in post-secondary education (PSE), which aligns with our findings that first-year students are most interested in future earnings prospects. Similarly, Long, Goldhaber and Huntington-Klein (2015) found that actual changes in wages by occupation affect the choice of major.
In the Canadian context, Oreopoulos and Dunn (2013) studied students from disadvantaged high schools in Toronto. They found that providing information about the benefits of PSE was associated with higher expected returns, lower concerns about costs, and greater likelihood of PSE attainment. Similarly, McGuigan, McNally, and Wyness (2018) found that students given access to an LMI website were more likely to enroll in vocational programs and ranked higher on LMI knowledge. This reinforces the need to deliver more structured LMI data to a much broader range of Canadians. Interestingly, they also found that those who could gain the most from easily accessible and understandable LMI were the least likely to search for it. The importance of finding ways to communicate LMI specific to the target group in question is clear.
Box 2: LMIC’s Previous Release on Accessible and Understandable LMI
High-level findings from the seven survey groups indicate that, even in this age of instant communications and advanced platforms for sharing LMI data, only half of Canadians, on average, use LMI (51%) or feel that finding it is easy (52%). As previously discussed, the unemployed have the most difficulty finding LMI (LMIC, 2019a).
We have also shown that even when LMI is found, it is often not easy to understand (35%). Again this challenge is most acute for unemployed persons (LMIC, 2019b). One potential reason is that LMI is too often
presented using terminology that may not be clearly defined or widely understood by the Canadian public. For instance, terms such as “job vacancy” or “skill requirements” may be interpreted differently, making interpretation of the data challenging.
However, a large share of respondents (84%) find LMI impactful on their career decision-making. This suggests that making LMI more accessible and easier to understand would be a meaningful improvement for many Canadians in making the best possible decisions about their career and life path (LMIC, 2019c).
LMIC has also released related findings on labour market information use by students and parents (LMIC, 2019f), employers (LMIC, 2019g), persons not in employment, education or training (NEET; LMIC, 2019i), recent immigrants (LMIC, 2019j), career development practitioners (LMIC, 2019k), and persons with disabilities (LMIC, 2020).
Milot-Lapointe, Savard, and Paquette (2018) examined the impact of assisted use of LMI on labour market outcomes. They found that individuals who use LMI supervised by career development professionals have better labour market outcomes than those not receiving similar guidance.
Some studies also highlight the challenges faced by individuals regarding LMI. Nachmias and Walmsley (2015) interviewed 28 volunteers, including final-year undergraduate hospitality management students from the UK. Students, they discovered, did not have enough understanding of the composition and nature of the labour market and had limited information on career alternatives. This resulted in a mismatch between their expectations for career progression and their satisfaction. Available LMI does not currently provide the necessary information andinsights expected by individuals, as our research also revealed.
As suggested by this brief literature review, there is scant research concerning actual perceptions of LMI. While there are admirable studies on how LMI impacts different outcomes, such as the choice of university program and retraining decisions, much more research can be done in this area. Our study seeks to fill some of these gaps by identifying the LMI that different groups of Canadians need in order to inform their decisions and inpointing some of the challenges associated with existing LMI. More research, including continued qualitative studies of targeted user groups (see Box 3), is needed to better understand and measure the precise effects of LMI on different outcomes.
Box 3: In Conversation with Students: The Information They Want on Wages
Findings of our qualitative research on the LMI needs of 35 students (aged 17–20) highlights that wage information is one of the key pieces of data that they want to confirm their decisions about career path (LMIC, 2019I).
Our in-depth conversations with young Canadians just starting out in PSE resulted in several recommendations:
First, information needs to be customizable to individual needs. Hourly wages might make more sense to one student, but another might make better use of annual salaries.
Second, the most useful wage information is forwardlooking and related to the student’s expected career path. The students stated a strong preference for average wages of graduates from their field of study two years after completing the program, as well as average wages in their desired occupations.
Third, information needs to be contextualized to provide a clear picture of their expected lifestyle. Information on net wages after taxes and deductions, and additional information on the cost of living, should accompany wage information.
Questionnaires and Data
Starting in August 2018, we surveyed nearly 17,000 individuals across seven different user groups in our public opinion research (see Box 1 for details). For this report, we focus on three questions asked of survey respondents, including a common set of answer options related to 1) what type of LMI respondents need, 2) what sources they use and 3) what challenges they face in finding them. Appendix A provides the questions and the answer options in detail.
We only use the data from respondents who reported at least one answer for each question (LMI needs, challenges and sources) for a final sample of 15,034 individuals. Table 1 in Appendix B breaks down these respondents by survey group and selected demographic variables. These data use the post-stratification weights of the 2016 Census to ensure that the pool of respondents approximates the Canadian population distribution across gender, age and survey group.
Information on salaries/wages, skill requirements and job benefits are the most frequently reported LMI needs. Women assign more importance to each of these needs compared to men.
LMI Needs
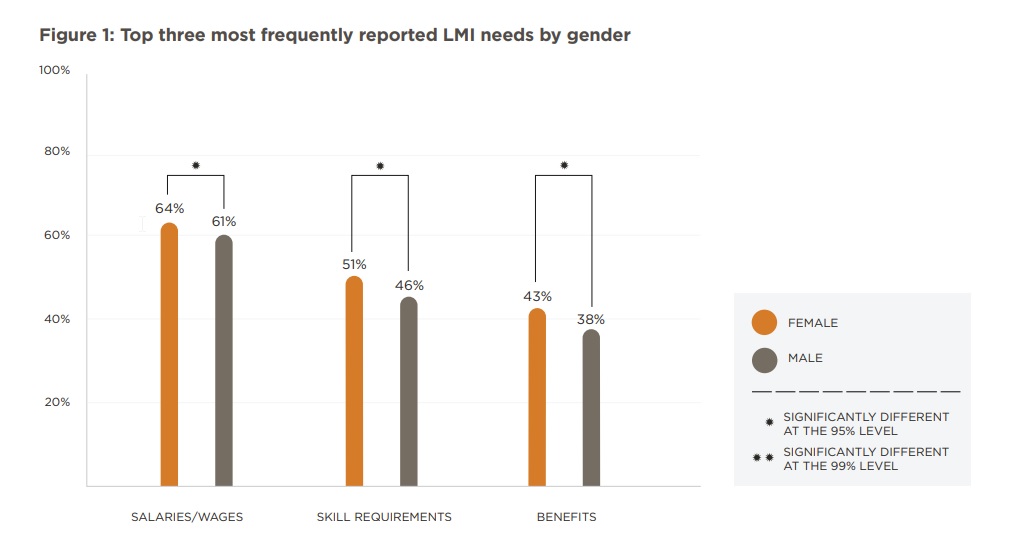
Overall, the most sought-after types of LMI are salaries/wages (62%), skill requirements (48%) and job benefits, including time off, pension plans, insurance, etc. (40%). Both women and men choose these three LMI as
their most sought-after types of information. Figure 1, however, shows that these LMI needs often differ significantly between men and women. For all three LMI needs, women assign more importance to each item compared to men.
Comparing across age groups also results in interesting differences. Figure 2 shows the share of respondents aged 18–24, 25–54 or 55+ who look for information about salaries/wages, skill requirements or benefits.
Canadians aged 25–54 are more likely to look for salary information (64%). This is slightly higher than for 18–24-year-old respondents (61%) and significantly higher than for those aged 55+ (56%)
People aged 55+ seek out information about salaries and benefits less often than younger people.
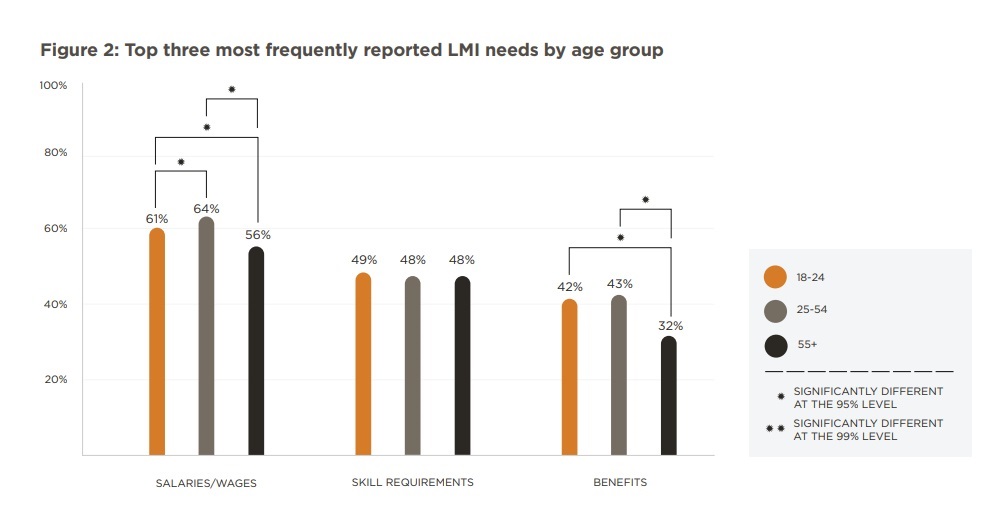
As with salary information, the oldest group (55+) is far less likely to seek out information about benefits (32%). The youngest (aged 18–24) and middle groups (aged 25–54) are more interestedin benefits (42% and 43% respectively). These results align with the notion that younger workers are trying to climb the career ladder more than those aged 55+.Conversely, information on skill requirements — the second most common LMI need — is consistent across the three age groups at about 48%.
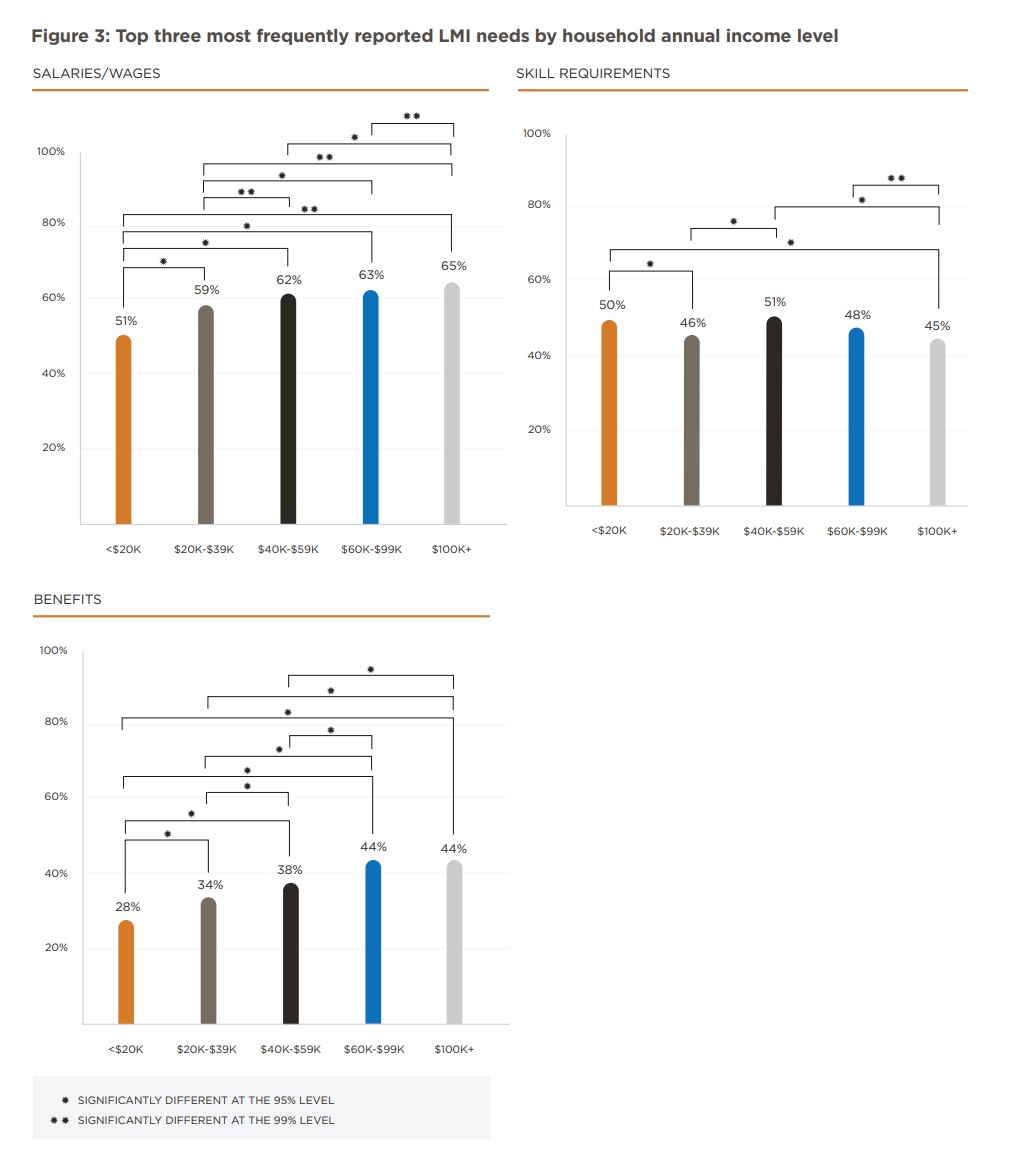
We also find a positive relationship between respondents’ need for salaries/wages and job benefits and their annual household income. Figure 3 compares the three most frequently selected LMI needs across five household annual income levels (less than $20,000, $20,000–$39,999, $40,000–$59,999, $60,000–$99,999, and over $100,000). Of those with household income under $20,000, 51% look for information on salaries/wages and 28% lookfor information on benefits. The proportion of respondents identifying both salary and benefits information as an LMI increases with income level. For example, 34% of those with household earnings 20,000–$39,999 look for information on benefits, which increases to 38% for those in the $40,000–$59,999 range, then to 44% for those earning $60,000 or more.
As with breakdown by age, the need for skills information is relatively consistent across income levels, ranging from 45% to 51% across all five groups. Most of these differences are not statistically significant.
Respondents in higher household income brackets are more concerned about wages and benefits (monetary) than respondents in lower household income brackets.
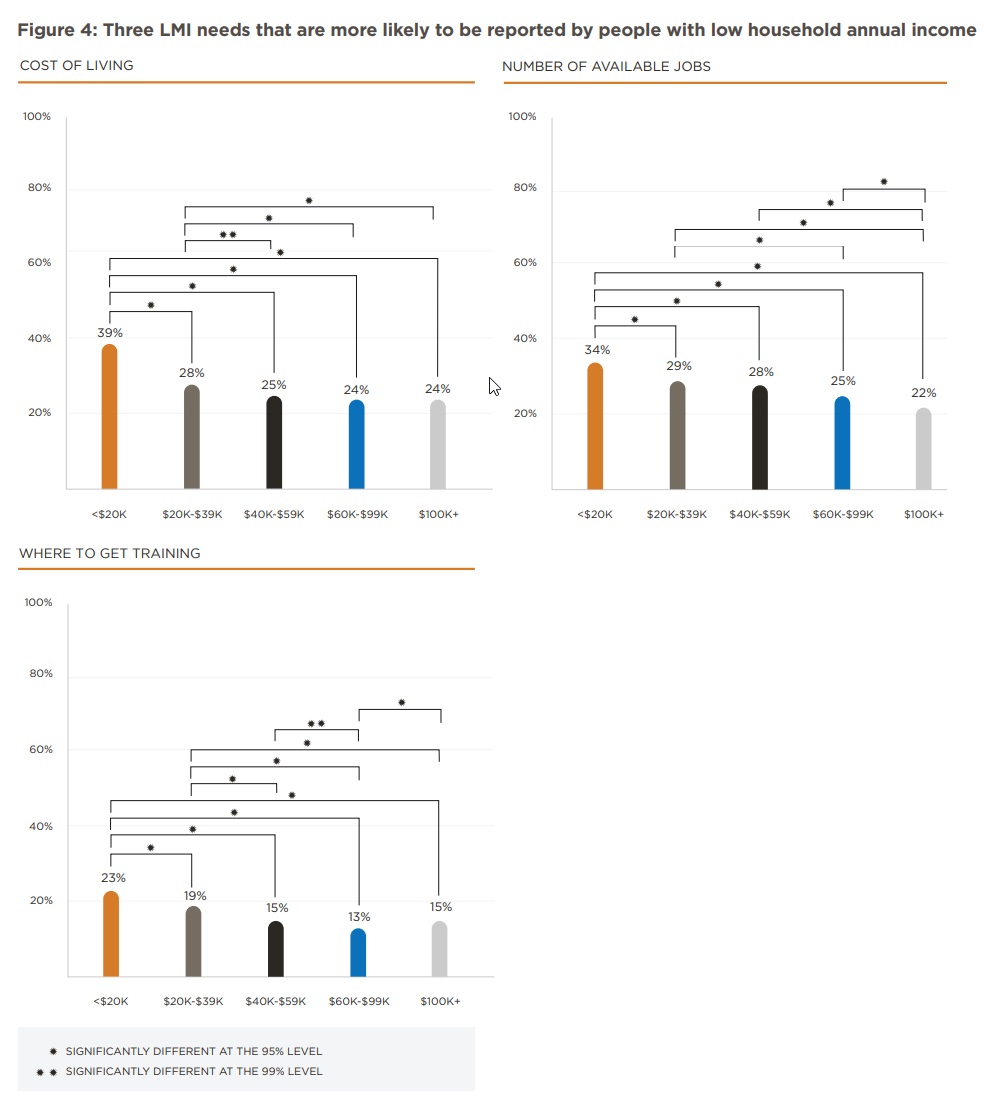
Going beyond the top three overall LMI needs, Figure 4 presents the LMI types frequently sought by those with lower household incomes, namely the cost of living, the number of available jobs and where to get job-related training. In each case, those with annual household earnings below $20,000 are far more likely to seek cost-of-living information (39%) versus those in other income groups (25–28%). A similar pattern is seen for the lowest income group in needing information about the number of jobs available (34%) and where to get training (23%). These LMI needs are significantly higher than for those in higher income groups.
Most likely, living in a low-income household leads people to pay more attention to the costs of living, such as housing, transportation, food and so on. Similarly, the potentially higher risk of unemployment for those of the low-income group motivates them to seek more information about the availability of jobs and work-related training. Also, among the seven groups surveyed, recent immigrants who have lived in Canada for under five years reported cost of living as their second most important LMI need (48%).
People with lower household incomes need information on cost of living, available jobs and where to get training more than those with higher household incomes
LMI Sources
After we learn what type of information is reported as LMI needs across gender, age, and income groups, thenext key question to ask is where the respondents obtain the LMI they seek. Understanding how Canadians receive their LMI informs how we can improve these sources through innovative platforms.
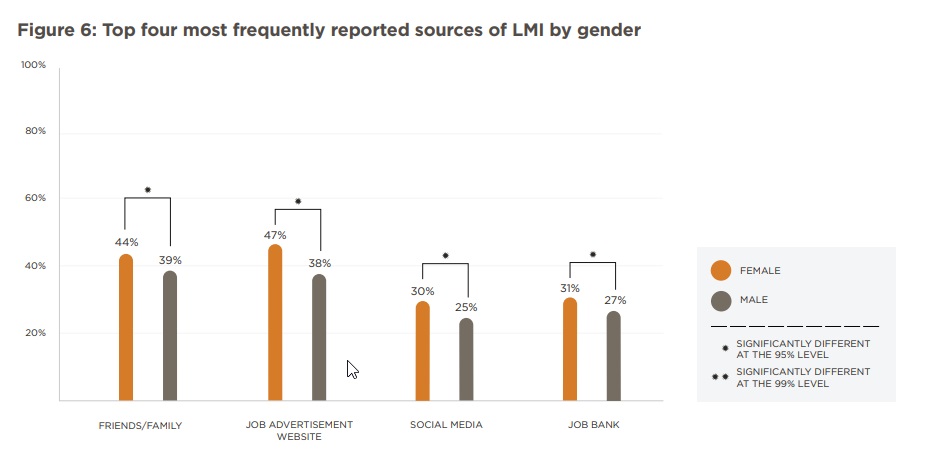
Friends/family, job advertisement websites and social media are the top sources of LMI. Women assign more importance to each of these sources compared to men.
Results suggest that people most often turn to friends or family (43%), job advertisement websites such as Monster, Indeed or Workopolis (42%) and social media (38%). For employed people and persons with disabilities, receiving information from employers is among their top three most frequent choices. Some parents also report using the Government of Canada’s Job Bank to collect information to help their children (see Figure 5 for more details by survey group).
Similar to the results reported for LMI needs, both women and men choose friends/family, job advertisement websites, social media and the Job Bank as their most frequently reported sources. However, women assign ore importance to each source compared to men, as seen in Figure 6.
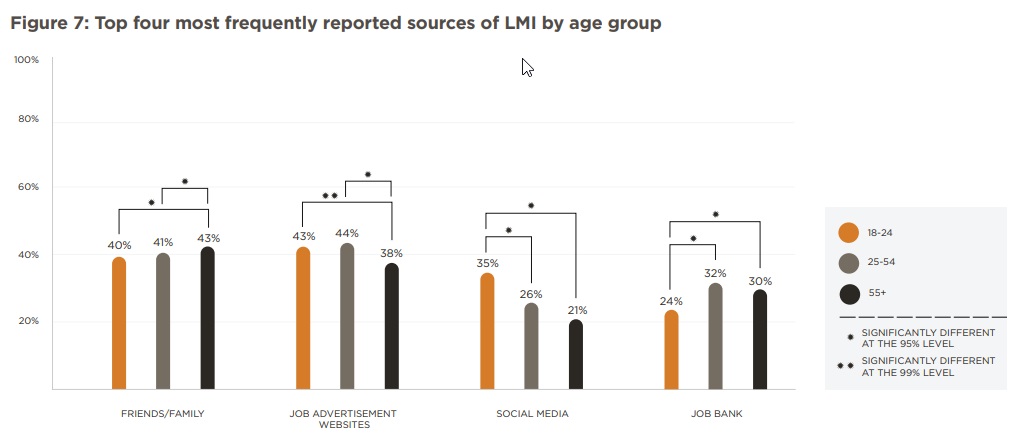
The most frequently selected source of LMI among those aged 55+ is friends/family (43%). Figure 7 shows, however, that this traditional source of information is also common for younger people (41%). Respondents younger than 55 use job advertisement websites (such as Monster, Indeed or Workopolis) and social media more than those over 55.
Young people are more likely to use job advertisement websites and social media than older people.
The use of social media, for instance, is significantly less among those aged 55+ (21%) or 25–54 (26%) compared to those aged 18–24 (35%). These differences highlight the importance of having access to updated and reliable information across a variety of platforms. Social media specifically might provide access to a large segment of younger workers but is less useful in delivering LMI to those over the age of 25.
The opposite pattern across age groups is seen for the Government of Canada’s Job Bank. About one-third of those over 25 (both the 25–54 and 55+ age groups) use Job Bank, compared to only one-quarter of those aged 18–24.
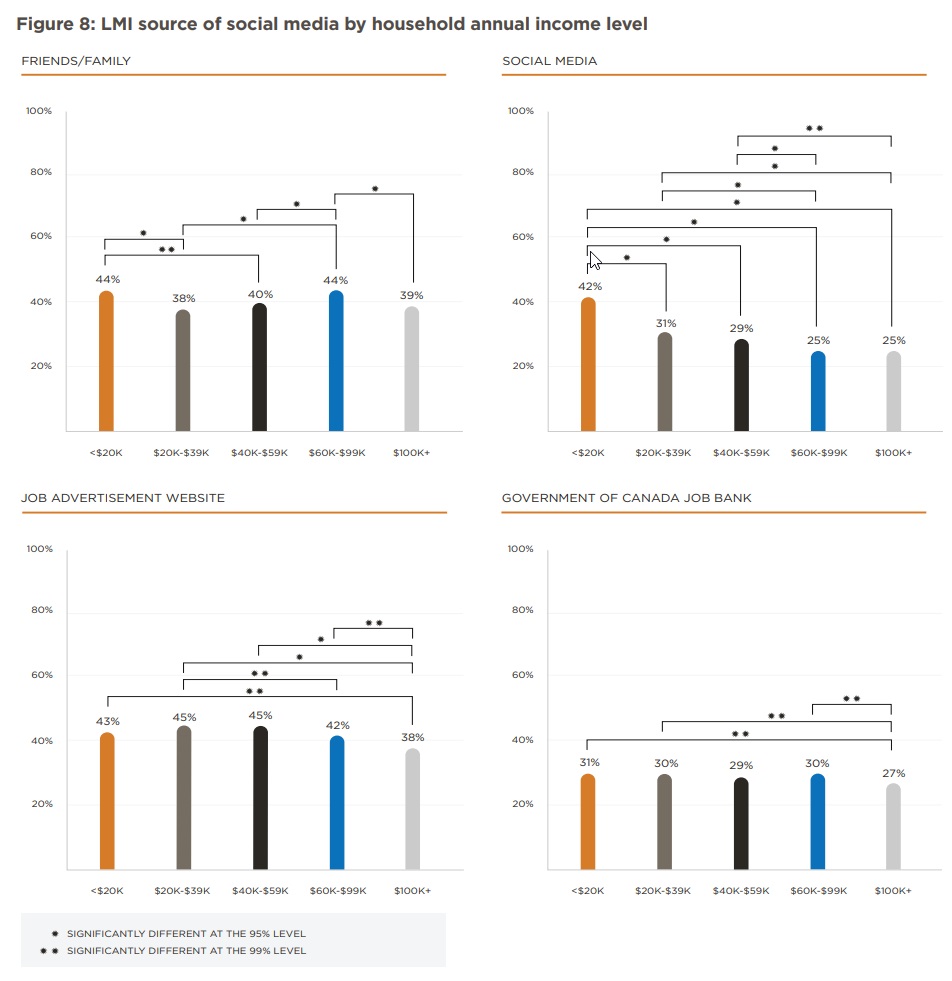
Furthermore, an interesting finding is the negative correlation between using social media as a source of LMI and income level. As shown in Figure 8, 42% of those in the lowest income group (less than $20,000/year) use social media for LMI, whereas fewer respondents in higher household incomes do (25–31%). Since social media is likely to have less reliable information, this is a concerning pattern. Those who stand to benefit the most from
high quality LMI may not be receiving it.
For the other sources of LMI – friends/family, websites, Job Bank – there are no obvious differences in use across income level.
People with low household incomes use social media to obtain LMI significantly more frequently than do other income groups.
As discussed, learning about the LMI sources that Canadians use helps us understand how they should be improved. When providing a new platform or updating the current sources of LMI, we should consider their accessibility, reliability and timeliness.
LMI Challenges
Learning about the challenges Canadians face can also help inform how we improve the collection, analysis and distribution of LMI in Canada. For this reason, we asked participants to identify their
challenges in finding, understanding and using job market information.
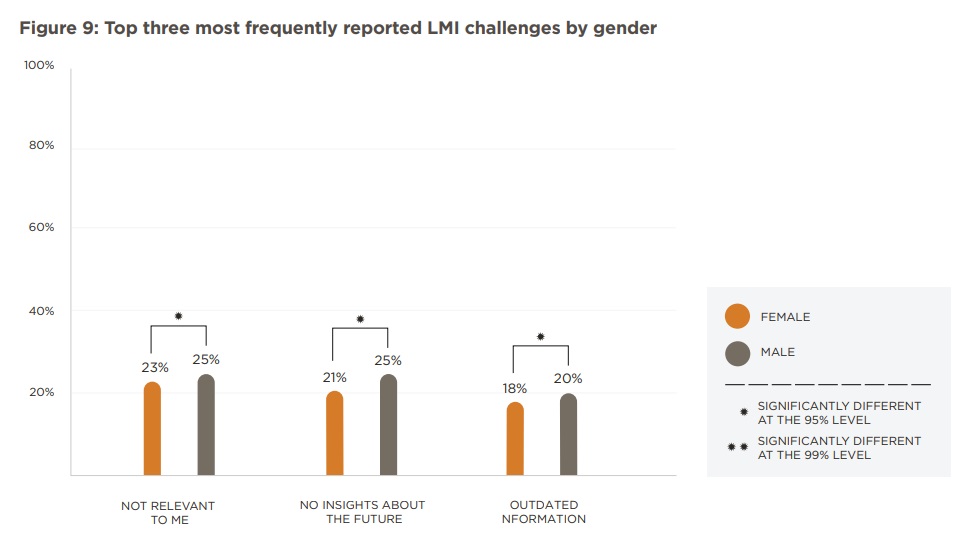
Overall, the three most frequently identified LMI challenges are these: 1) the available information does not provide insights into the future (24%), 2) does not apply to the respondent’s situation (23%) and 3) is out of
date (19%).
It is not surprising that the most frequent complaint was “no insights about the future.” Predicting the future of work accurately is a challenge due to the complex interplay of technology, demographics, socioeconomic trends and other factors affecting supply and demand (see LMIC, 2019m). While more should be done to provide forward-looking information to users, LMI providers must be careful to contextualize the limitations and uncertainties associated with any forecast, including data on future wages, skills requirements and job openings.
Canadians told us that the available LMI is often irrelevant, outdated, and provides no insights about the future. Women assign less importance to each of these challenges compared to men.
The fact that LMI may not apply to the individual’s situation is closely associated with the lack of localized, granular information (see LMIC, 2019h). This finding also highlights the importance of learning more about different groups of LMI users in order to provide information focused on their specific needs (see Box 2).
Again, similar to results reported on LMI needs and sources, we find that both women and men choose the same most frequently reported challenges. Unlike with LMI needs and sources, however, women are less concerned about the top three LMI challenges compared to men, as shown in Figure 9.
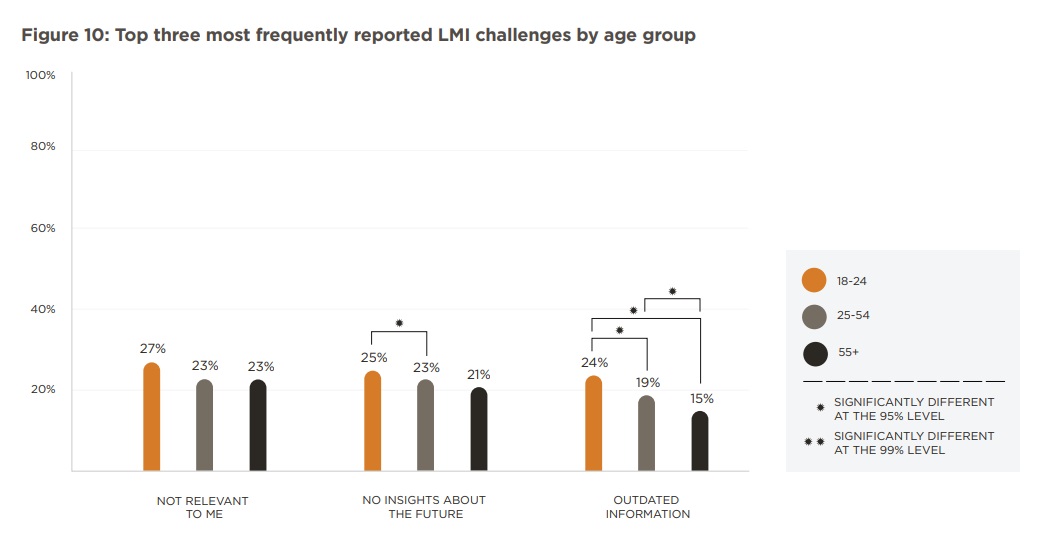
In Figure 10, the top three most frequently selected LMI challenges are presented across the three age groups. Young people cite these challenges more frequently than do older respondents. In other words, those aged 18–24 may be facing greater challenges with getting useful information from the current LMI system. They need information relevant to their situations, which are different than those of older people. They need more up-to-date information with more insight about the future and how jobs are going to adapt to the changing world of work. We find no specific pattern, however, when comparing the frequency of challenges across income groups.
Young people face more challenges with outdated and no-future-related LMI.
Putting It All Together
Nine different Canadian groups participated in our public opinion research surveys to help us identify their most common LMI needs, the sources they use, and the challenges they face in using LMI. In focusing on seven of those groups in this report, we find that people with higher household incomes are more likely to ask for information on salaries and benefits, whereas people with lower household incomes are more likely to need information on cost of living, available jobs and where to get training.
Our findings also show that friends/family, job advertisement websites and social media are the most common sources of LMI. Young people are ore likely to use job advertisement websites and social media than older people. Respondents also report that available LMI is outdated and not relevant to their situations, providing insufficient insight about the future. Generally, young peopleare more likely to say that they are affected by these challenges than older people.
Overall, these results call on LMI providers, governments, employers and other organizations to understand two key issues: 1) the type of information, sources and challenges varies across user groups; 2) the decision about what source to use, where to find it and how to digest the information varies by socio-demographic factors such as gender, age and household income. As a result, we need to ensure that available information addresses the needs of diverse groups of Canadians and that LMI be tailored as much as possible to address their unique user experiences.
Acknowledgments
This LMI Insight Report was prepared by Behnoush Amery of LMIC with the support of Emna Braham, Anthony Mantione, Bolanle Alake-Apata, Zoe Rosenbaum, Kevin Saade, Elba Gomez and David Goulet. We thank Sareena Hopkins (Canadian Career Development Foundation), Ron Samson, Austin Harcs and Mark Patterson (Magnet), Parisa Mahboubi (C.D. Howe Institute), Ather Akbari (Saint Mary’s University), and Emile Tompa (Institute for Work & Health) for their feedback. For more information about the public opinion research, please see our project page, survey dashboards and previous LMI Insight Reports. You may also contact Behnoush Amery, Senior Economist, at behnoush.amery@lmic-cimt.ca, or Tony Bonen, Director, Research, Data and Analytics, at tony.bonen@lmic-cimt.ca.
References
Beffy, M., Fougere, D., & Maurel, A. (2012). Choosing the field of study in postsecondary education: Do expected earnings matter? Review of Economics and Statistics, 94(1), 334–347. Retrieved from http://www.amaurel.net/IMG/pdf/Choosing-the-Field-of-Study.pdf
Behavioural Insights Team. (2016, August 25). Moments of choice. Final Report. Retrieved from https://www.bi.team/wp-content/uploads/2016/08/Moments-of-Choice-report.pdf
Boucher, V., Dedewanou, F. A., & Dufays, A. (2018, September). Peer-induced beliefs regarding college participation. Centre de recherche sur les risques les enjeux économiques et les politiques publiques. Retrieved from https://pdfs.semanticscholar.org/a19f/2ee058c7fc74b993c78066b1111f609cf976.pdf
LMIC. (2019a, January). Is it difficult to find information that helps career-related decisions? LMI Insights, 5. Retrieved
from https://lmic-cimt.ca/wp-content/uploads/2019/01/LMI-Insights-No.-5.pdf
LMIC. (2019b, January). Easily understood LMI is essential for making informed career decisions. LMI Insights, 6.
Retrieved from https://lmic-cimt.ca/wp-content/uploads/2019/01/LMI-Insights-No-6.pdf
LMIC. (2019c, January). LMI has important impact on the career paths of Canadians. LMI Insights, 7. Retrieved from
https://lmic-cimt.ca/wp-content/uploads/2019/02/LMI-Insights-No-7.pdf
LMIC. (2019d, February). LMI most wanted by Canadians: Wages and skills. LMI Insights, 8. Retrieved from
https://lmic-cimt.ca/wp-content/uploads/2019/02/LMI-Insights-No-8.pdf
LMIC. (2019e, February). Canadians face persistent challenges when looking for job-related information. LMI Insights, 9. Retrieved from https://lmic-cimt.ca/wp-content/uploads/2019/02/LMI-Insights-No-9.pdf
LMIC. (2019f, March). Educational and career choices for students and parents: The role of labour market information.
LMI Insights, 11. Retrieved from https://lmic-cimt.ca/wp-content/uploads/2019/03/LMI-Insights-No-11.pdf
LMIC. (2019g, May). Canadian employers: Uneven access to labour market information. LMI Insights, 13. Retrieved from
https://lmic-cimt.ca/wp-content/uploads/2019/05/LMI-Insights-No-13.pdf
LMIC. (2019h, July). Search for the LMI grail: Local, granular, frequent, and timely data. LMI Insights, 15. Retrieved from
https://lmic-cimt.ca/wp-content/uploads/2019/07/LMI-Insights-No-15.pdf
LMIC. (2019i, August). Finding their path: What youth not in employment, education or training (NEET) want.
LMI Insights, 17. Retrieved from https://lmic-cimt.ca/wp-content/uploads/2019/08/LMI-Insights-No-17.pdf
LMIC. (2019j, November). Settling down: Recent immigrants and labour market information. LMI Insights, 19. Retrieved
from https://lmic-cimt.ca/wp-content/uploads/2019/11/Insights-Issue-19-ENG_v7.pdf
LMIC. (2019k, November). From data to information: What LMI do career development practitioners need?
LMI Insights, 20. Retrieved from https://lmic-cimt.ca/wp-content/uploads/2019/11/Insights-20_ENG_v6.pdf
LMIC. (2019l, November). In conversation with students: The information they want on wages. LMI Insights, 21.
Retrieved from https://lmic-cimt.ca/wp-content/uploads/2019/11/LM-Insight-Report-no-21.pdf
LMIC. (2019m, December). Understanding the interconnectedness of the future of work: A case study in what’s wrong with current discussions. LMI Insights, 22. Retrieved from https://lmic-cimt.ca/wp-content/uploads/2019/12/LMI-Insight-Report-no-22.pdf
LMIC. (2020, January). Improving the accessibility of labour market information: Survey results from persons with disabilities. LMI Insights, 23. Retrieved from
https://lmic-cimt.ca/wp-content/uploads/2020/01/LM-Insight-Report-no-23.pdf
Long, M. C., Goldhaber, D., & Huntington-Klein, N. (2015). Do completed college majors respond to changes in wages?.
Economics of Education Review, 49, 1-14.
McGuigan, M., McNally, S., & Wyness, G. (2016). Student awareness of costs and benefits of educational decisions:
Effects of an information campaign. Journal of Human Capital, 10(4), 482–519. doi:10.1086/689551
Milot-Lapointe, F., Savard, R., & Paquette, S. (2018). Effect of labour market information (LMI): Comparison
between independent and assisted use of LMI. Canadian Journal of Career Development/Revue canadienne de
développement de carrière, 17(1), 43–52. Retrieved from http://cjcdonline.ca/2019/06/effect-of-labour-marketinformation-lmi-comparison-between-independent-and-assisted-use-of-lmi/
Nachmias, S., & Walmsley, A. (2015). Making career decisions in a changing graduate labour market: A hospitality
perspective. Journal of Hospitality, Leisure, Sport and Tourism, 17, 50–58. doi:10.1016/j.jhlste.2015.09.001
Oreopoulos, P., & Dunn, R. (2013). Information and college access: Evidence from a randomized field experiment.
Scandinavian Journal of Economics, 115(1), 3–26. doi:10.1111/j.1467-9442.2012.01742.x
Ruder, A. I., & Van Noy, M. (2017). Knowledge of earnings risk and major choice: Evidence from an information
experiment. Economics of Education Review, 57, 80–90. doi:10.1016/j.econedurev.2017.02.001
Wiswall, M., & Zafar, B. (2014). Determinants of college major choice: Identification using an information experiment.
Review of Economic Studies, 82(2), 791–824. Retrieved from https://www.newyorkfed.org/medialibrary/media/
research/staff_reports/sr500.pdf
Appendix A: Questions and Answers on LMI Needs, Sources and Challenges
To account for the different circumstance of each group surveyed, the three main questions discussed here were phrased slightly differently across the seven surveys. For instance, unemployed persons were questioned about the LMI required in their current job search, whereas employed persons were asked about the LMI used to find their current job; or parents were questioned about their children’s job search experience. Regardless of the precise formulation of the question, the set of answer options available were identical in each survey. The main three questions are as follows:
LMI needs: When you were looking for job, which of the following types of information, if any, did you take into consideration? (multiple selections allowed)
- Number of available jobs
- Expected/projected future job openings
- Salaries/wages
- Specific business sector conditions
- Technologies impacting jobs
- Certification or education requirements
- Skill requirements
- Workplaces environment
- Cost of living
- Benefits (time off, pension plans, insurance, etc.)
- Labour law and regulation
- Self-employment information
- Transferability of skills
- Where to get training
- Other
- None of these
LMI sources: Which of the following sources, if any, did you use to find job market information? (multiple selections allowed)
- Statistics Canada website
- Other government of Canada website
- Government of Canada Job Bank
- Provincial/territorial government website
- Employment agency/organization website or publication
- Not-for-profit/charity/settlement organization website
- Municipal (city) website
- Job advertisement website (Monster, Indeed, Workopolis etc.)
- Social media
- Friends/family
- Third party (consulting firm etc.) website or publication
- Industry associations
- Employers
- News media website or publication
- Other
- None of the above
LMI challenges: Which of the following challenges did you face, if any, in finding job market information? (multiple selections allowed)
- Did not find the information I was looking for
- Did not find the information on my specific city or town
- Did not find information on my specific industry
- Did not find information on my specific field (or occupation)
- The information was out of date
- The information did not provide insights into the future
- The information was confusing or hard to understand
- The information didn’t apply to my situation
- Other
- None of the above
Appendix B: Summary Statistics of Sample
Table 1: Percentages of Respondents by Demographic across Seven Survey Groups
| Survey Group | Employed Persons | Persons with Disabilities | Recent Immigrants | Recent Graduates | Unemployed | Parents | Current Students |
|---|---|---|---|---|---|---|---|
| All (n = 15,034) | 3,112 (21%) | 698 (4%) | 827 (5%) | 2,735 (18%) | 2,902 (20%) | 2,924 (20%) | 1,836 (13%) |
| Gender | |||||||
| Female | 55% | 52% | 53% | 63% | 64% | 60% | 66% |
| Male | 44% | 47% | 46% | 36% | 35% | 40% | 32% |
| Prefer not to say | 1% | 1% | 1% | 1% | 1% | 0% | 2% |
| Age Group | |||||||
| 18–24 years old | 3% | 7% | 10% | 24% | 17% | 1% | 61% |
| 25–54 years old | 71% | 59% | 82% | 67% | 61% | 61% | 30% |
| 55+ years old | 22% | 28% | 2% | 2% | 16% | 35% | 1% |
| Prefer not to say | 4% | 6% | 6% | 7% | 6% | 3% | 8% |
| Income Group | |||||||
| Less than $20K | 3% | 10% | 11% | 6% | 24% | 3% | 17% |
| $20K–$39K | 11% | 17% | 18% | 17% | 20% | 8% | 20% |
| $40K–$59K | 15% | 16% | 20% | 19% | 16% | 12% | 15% |
| $60K–$99K | 31% | 20% | 25% | 29% | 18% | 30% | 23% |
| $100K and more | 29% | 14% | 10% | 18% | 0% | 35% | 14% |
| Prefer not to say | 11% | 7% | 7% | 17% | 15% | 12% | 11% |
| Missing | 0% | 16% | 9% | 4% | 7% | 0% | 0% |
| Region Type | |||||||
| Urban | 86% | 74% | 88% | 86% | 84% | 85% | 86% |
| Rural | 14% | 26% | 12% | 14% | 16% | 15% | 14% |
| Provinces and Territories | |||||||
| Alberta | 15% | 12% | 12% | 13% | 14% | 15% | 11% |
| British Columbia | 11% | 13% | 14% | 11% | 11% | 12% | 11% |
| Manitoba | 5% | 5% | 6% | 4% | 4% | 4% | 6% |
| New Brunswick | 2% | 2% | 2% | 3% | 3% | 3% | 2% |
| Newfoundland & Labrador | 2% | 1% | 2% | 3% | 3% | 3% | 3% |
| Nova Scotia | 5% | 4% | 2% | 5% | 4% | 5% | 3% |
| Northwest Territories | 2% | 4% | 1% | 0% | 0% | 2% | 1% |
| Nunavut | 2% | 0% | 1% | 0% | 0% | 0% | 1% |
| Ontario | 35% | 46% | 32% | 33% | 36% | 37% | 31% |
| Prince Edward Island | 2% | 2% | 1% | 1% | 1% | 2% | 2% |
| Quebec | 14% | 7% | 22% | 23% | 19% | 13% | 25% |
| Saskatchewan | 3% | 3% | 3% | 4% | 3% | 3% | 4% |
| Yukon | 2% | 1% | 1% | 0% | 0% | 1% | 0% |


