Table of Contents
Key Findings
- Online job postings provide timely, detailed estimates of the number and distribution of job vacancies, but caution is needed when using these data as a proxy for labour demand.
- First, even though many employers actively recruit online, job postings do not precisely represent job vacancies due to issues of interpretation.
- Second, caution is needed in how online job posting data are collected, which can skew the types and location of those postings in comparison to other related data sources.
- In comparing data from Vicinity Jobs to the Job Vacancy and Wage Survey (JVWS), several tendencies emerge:
- At the Canadian level, online job postings are skewed toward professional and service sector occupations, underrepresenting trades and other manual labour professions.
- Occupations that require university education are overrepresented in online job postings while jobs requiring a secondary school education or on-the-job training are underrepresented. Related, at each geographic level, management occupations are overrepresented in online postings.
- At the provincial and regional levels, the sample sizes of official job vacancy surveys are smaller compared to what can be captured through online job postings.
- Online job postings in Toronto, Vancouver, and Montreal are underrepresented while online job postings in other metropolitan and non-metropolitan areas are overrepresented.
- The benefits of online job postings are numerous and can offer an important complement to official statistics on job vacancies as long as – as with any data sources – its limitations are borne in mind.
Introduction
Data from online job postings can complement survey data on job vacancies to help inform our understanding of unmet labour demand. Online job postings offer numerous advantages including, but not limited to, the following:
- Timeliness — data are near real time
- Localness — observations are available for small geographies
- Granularity — employer information, potential to track user information like click rates or posting views, other information such as offered wages and required education and certifications are sometimes available
Furthermore, online job postings contain unique insights on the work requirements sought by employers looking to hire. A discussion of the benefits and limitations of work requirements observed in online job postings can be found in the background documentation of LMIC’s Canadian Online Job Posting Dashboard. However, for this LMI Insight Report, the focus is on the accuracy and representativeness of online job postings to assess the feasibility of using these data in the same way that job vacancy data measures unmet labour demand.
Although many unique insights can be gleaned from online job postings, such data suffer from significant bias towards certain occupations, sectors and regions. This lack of representativeness hinders using these data to estimate job vacancies. The challenge for policy makers, employment service providers, career development professionals and others who track labour market trends is that we do not have a clear picture about how biased and limited this information is. To explore the representativeness of online job postings, we draw on data provided by Vicinity Jobs (see Box 1). We compare the distribution of online job postings by occupation, province and education level against the same information observed in the Job Vacancy and Wage Survey (JVWS). Although the JVWS has several limitations and caveats itself, including for instance the exclusion of federal, provincial and territorial administrations from the survey, it is nevertheless the most robust and representative source of job vacancies information available in Canada. The comparisons discussed below show that online job posting data are skewed toward service-sector professions that often require university-level education.
Box 1: Vicinity Jobs
Vicinity Jobs is a Canadian company based in Vancouver that deals with big data analytics and internet search technologies. Each week, data are collected from thousands of French and English websites across Canada, yielding approximately 200,000 new, unique online job postings per month. Using a machine learning technique called natural language processing (NLP), Vicinity Jobs then extracts information about occupation, location, and work requirements (including skills) from each posting. Beginning in January 2018, Vicinity Jobs has collected online job postings daily in both official languages, each uniquely identified on the day it is first observed. Every month, Vicinity Jobs cleans and structures this data, which includes removing duplications.
Context, Please
The efficient matching of workers to jobs is the hallmark of a well-functioning labour market, and directly impacts a country’s standard of living and potential for economic growth. To facilitate matching workers with jobs, it is critical that all stakeholders know where job opportunities are emerging and if the skills job seekers have represented those needed. This requires timely, local, granular labour market information. This is especially true as millions of workers are displaced by the COVID-19 pandemic.
Job opportunities are measured as vacancies representing the unmet demand for labour (i.e., the number of workers that employers are trying to recruit). Typically, this is estimated through firm-level employer surveys. In Canada, the primary source for measuring vacancies is the Job Vacancy and Wage Survey (JVWS) (see Box 2).
The JVWS provides reliable information by region and occupation but, as with most surveys, has a smaller sample size that limits the localness of available observations. It also excludes some large employers, such as Federal, provincial and territorial administrations and comes with a considerable time lag. To address such limitations, using online job posting data to estimate vacancies has been gaining favour over the past few years. Online job posting data, collected from publicly available websites, are available in near real-time for detailed occupations and locations (e.g., city or town). As such, this emerging data source provides more timely, local, granular information than survey data. Moreover, online job postings offer additional dimensions of key information, such as the skills, knowledge, tools and technology, and other work requirements needed by job seekers.
Box 2: The Job Vacancy and Wage Survey (JVWS)
Statistics Canada collects and estimates job vacancy levels and rates across Canada primarily through the Job Vacancy and Wage Survey (JVWS). The survey was introduced in February 2015 to produce more localized, statistically representative vacancy estimates by detailed National Occupational Classification (NOC) codes (4-digit) and by economic region.
The JVWS sampling framework uses the Business Register (BR) – a central statistical register of approximately 900,000 businesses and institutions across Canada – to generate a sample of about 100,000 businesses to survey each quarter. These businesses are further divided into three groups; each group is surveyed during one of the three months of the quarter. Since the same job vacancy can overlap multiple quarters, average annual vacancies can be calculated by taking the average quarterly estimates over a year.
The target population is defined as all business locations operating in Canada that have at least one paid employee. The industrial sectors not included are religious organizations, private households as well as international and other extra-territorial public administrations. Federal, provincial and territorial administrations are also excluded from the survey.
The target population is defined as all business locations operating in Canada that have at least one paid employee. The industrial sectors not included are religious organizations, private households as well as international and other extra-territorial public administrations. Federal, provincial and territorial administrations are also excluded from the survey.
Vacancy data from the survey are available quarterly, two to three months following the reference period (except for 2019 Q4, delayed due to the COVID-19 pandemic). For example, data for 2018 Q1 were collected during January, February and March 2018 with results available in June 2018.
Waiting for the “But”
As promising as data collected from online job postings are, however, important limitations should be considered when using or interpreting the data.
Conceptually, online job postings and job vacancies are distinct (see Box 3). First, not all vacancies are posted online and each job posting (online and offline) may entail one or more vacancies. Second, job vacancies posted online, as we show below, overrepresent certain occupations (such as health care and IT) and underrepresent others (such as construction and agriculture). Third, counting job postings may overestimate vacancies. For example, the employer may maintain a job posting that they are not currently seeking to fill (in which case the posting does not technically represent a vacancy as defined in the JVWS). Conversely, counting job postings may underestimate vacancies if, for example, the employer intends to fill multiple positions using a single online advertisement.
Broadly, online job posting information suffers from limitations and biases. Through the remainder of this report we explore the representativeness of online job posting data by using the JVWS vacancy data as the baseline comparison. However, the JVWS is not without its own shortcomings. Since the JVWS reports both existing and anticipated job vacancies, after the survey the business may change and the job vacancy may never materialize. Further, the quarterly reporting structure plus the normal three-month lag before data are published means that JVWS information is up to six months out of date, so it cannot be used to inform real-time policy decisions. As a survey, the JVWS is subject to sampling errors and non-sampling errors such as non-response, incorrect interpretation of the questions, as well as coverage and classification errors. Finally, the JVWS does not survey federal, provincial and territorial administrations., which represents about 5% of employment in Canada and would typically include a considerable number of management occupations.
Box 3: What is Being Measured?
A job vacancy broadly refers to an unfilled position within an organization for which the employer is looking to hire.
In the JVWS, three criteria must be fulfilled for a position to be counted as a vacancy: 1) the job is vacant on the first day of the month or will become vacant in the same month being surveyed; 2) there are tasks to be carried out during the month for the job in question; and 3) the employer is actively seeking a worker outside the organization to fill the job.
Online job postings, on the other hand, are not regulated by any such criteria. There is nothing, for example, to prevent employers from posting positions for which they are not actively hiring or for which they plan to hire several months in the future.
Into the Weeds
To quantify the representativeness of online job posting data in Canada, we compare data provided by Vicinity Jobs to the JVWS, which we treat as the true distribution of vacancies across the country (see Box 3). Online job posting data are time stamped by the day found (and included in the data only when first observed), so we first aggregate the individual records to quarterly periods grouped by geography, occupation and other features available in the data.
During the period between Q1 2018 and Q3 20191 the JVWS recorded a total of 3,757,310 job vacancies versus 4,754,555 online job postings — a difference of 21%. Comparing the data by quarter, the overestimate of the number of online job postings versus the JVWS estimate of total vacancies varies between 28% and 11% (see Figure 1). On average, the number of job vacancies in the JVWS per quarter is 536,758 while the number of online job postings is 679, 222.
Although the difference in counts of vacancies versus job postings varies over time, online job posting counts are consistently higher than the estimated vacancies in the JVWS. A key reason for this persistent overestimation is because the JVWS does not survey public administration employers, and we estimate that online job postings in the public administration sector represent roughly 2% of the total.2 Another reason is because what is being measured as a “job opening” is different between online job posting data and the JVWS. For example, since the JVWS only asks for current or future vacancies, it is possible that after the survey is conducted, business needs change and actual vacancies (and online job postings) are greater (or less) than expected (and reported). Further, in the JVWS, the position must be available within the month, but the opening might be posted online pre-emptively to avoid a vacancy occurring or for employers to stockpile resumes in case opportunities arise in the future.
Another reason for the higher count of online job postings is the duplication of online job postings across different websites. As with other online data collection firms, Vicinity Jobs has developed a series of protocols and algorithms to “de-duplicate” job posting data, but no such algorithm for cleaning the data is perfect. Vicinity Jobs estimates that 95% of duplicates are successfully removed, meaning that approximately 5% of observations are double counted.
Total counts provide only a general framework for understanding the differences between the two data sources. More important is how representative the data sources are across key dimensions such as occupations, geographies and education levels. Given the consistent difference in the overall count of online job postings and vacancies, we focus on the shares of the two measures relative to the total count in the relevant region or occupational category. This approach offers better insights about the representativeness of online job posting data.
Digging Down: Comparing Distributions across Occupational Groups
In comparing the distribution of JVWS vacancies and online job postings, we calculate shares at the 1-, 2- and 4-digit NOC levels across the country and by province. Further, we test the statistical significance of the difference of these distributions to draw conclusions about the representativeness of online job postings (see Appendix A).3 In this analysis, we focus on Q1 2018 to Q3 2019, the latest period for which JVWS data are available.
An observation is considered accurately represented online if the share of online job postings is within the 95% confidence interval for the corresponding share of vacancies in the JVWS. If the share does not fall within that interval, then it is deemed over- or underrepresented (based on whether the online job posting share is greater or less than the corresponding job vacancy share). Figure 2 shows the occupational shares of online job postings that are overrepresented (above the 45-degree angle line), underrepresented (below the 45-degree angle line) and accurately represented (the error bar crosses the 45-degree line) for all of Canada. Occupations at the 1-digit NOC level are colour-coded. Data visualizations not presented in the text are available in Appendix B.
Figure 2: At the 1-digit NOC, 49% of observations are overrepresented online, 43% are underrepresented and 9% are not statistically different between online job posting data and the JVWS.
Distribution of online job postings and JVWS vacancies, Canada-wide, quarterly.
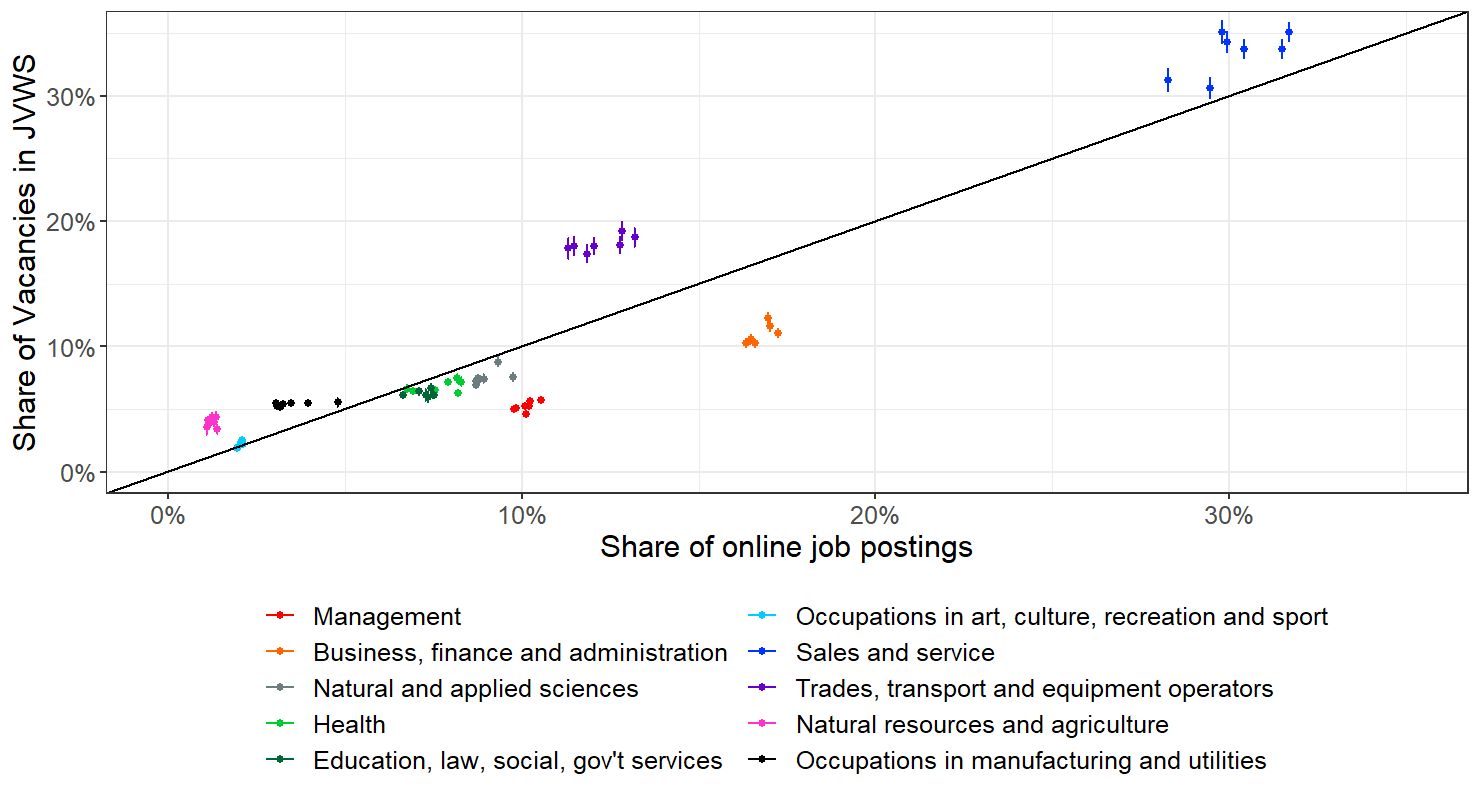
At the 1-digit NOC level, 49% of occupations are overrepresented online, 43% are underrepresented and 9% are accurately represented (see Figure 1). Table 4 (see Appendix C) summarizes the visualization above and provides further information about the degree to which online job postings under- or overrepresent vacancies by occupation. At the pan-Canadian and NOC1 level, overrepresented occupations include 1) management (NOC 0); 2) business, finance and administration (NOC 1); 3) health (NOC 3); and 4) education, law and social, community and government services (NOC 4). Conversely, occupations underrepresented online include 1) sales and service (NOC 6); 2) trades, transport and equipment operators (NOC 7); 3) natural resources, agriculture and related production (NOC 8); and 4) manufacturing and utilities (NOC 9).
These findings show that at the 1-digit NOC level, occupational shares of online job postings and job vacancies are not proportional. At this level, almost every occupation is significantly over- or underrepresented. The sole exception is broad occupational category 5 — art, culture, recreation and sport — for which 71% of the observations are accurately represented by online postings.
The share of accurately represented occupations increases markedly when unit groups (i.e., 4-digit NOC level) are analyzed (see Table 1). The percentage of occupational shares over- and underrepresented decreases substantially for occupational groups 0–4 and 6–9. Specifically, at the 4-digit level, most quarterly shares of natural and applied sciences and related occupations (NOC 2) and trades, transport and equipment operators and related occupations (NOC 7) are not statistically different (whereas at the 1-digit NOC it was 100% overrepresented and 100% underrepresented, respectively).
Table 1: Across Canada, Online Job Postings are Often Representative at the Detailed Occupational Level
Pan-Canadian share of unit groups (NOC 4) of online job postings that are above, below or within the 95% confidence interval of the JVWS shares, by quarter. 4
| Broad occupational categories | % not significantly different | % significantly underrepresented online | % significantly overrepresented online |
| NOC 4 level | NOC 4 level | NOC 4 level | |
| 0 – Management occupations | 31% | 26% | 43% |
| 1 – Business, finance and administration occupations | 34% | 11% | 55% |
| 2 – Natural and applied sciences and related occupations | 51% | 21% | 28% |
| 3 – Health occupations | 31% | 14% | 55% |
| 4 – Occupations in education, law and social, community and government services | 34% | 33% | 33% |
| 5 – Occupations in art, culture, recreation and sport | 51% | 10% | 39% |
| 6 – Sales and service occupations | 30% | 37% | 33% |
| 7 – Trades, transport and equipment operators and related occupations | 53% | 33% | 14% |
| 8 – Natural resources, agriculture and related production occupations | 36% | 57% | 7% |
| 9 – Occupations in manufacturing and utilities | 40% | 44% | 16% |
Figure 3: At the 1-digit NOC and provincial level, 36% of observations are overrepresented online, 29% are underrepresented and 35% are not statistically different between online job posting data and the JVWS.
Distribution of online job postings and JVWS vacancies, by province, quarterly.
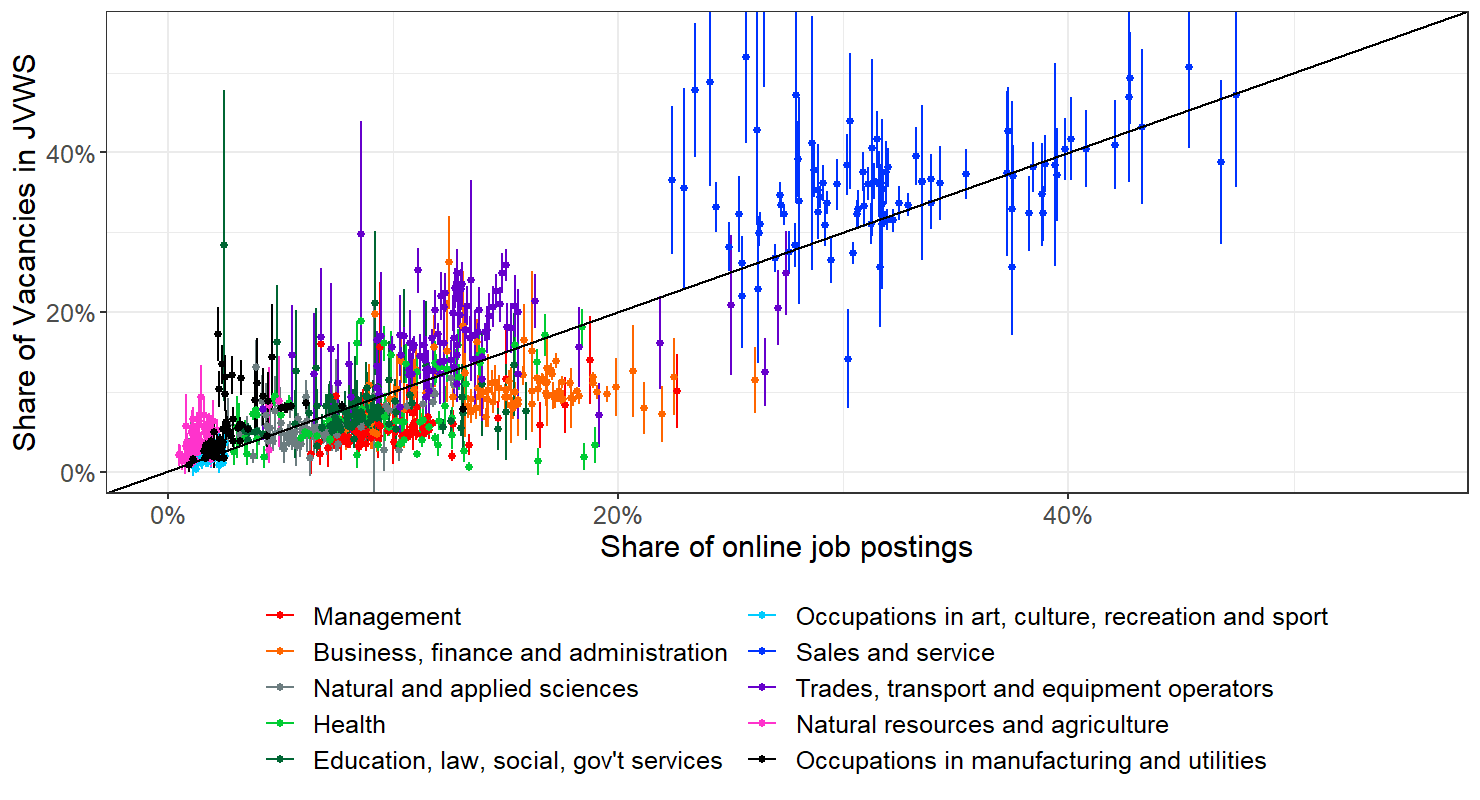
Cutting the data further to analyze the distribution of occupations within each province, we find that online job posting data accurately represent 35% of observations at the 1-digit NOC level. At 14%, the share of representative observations is about half as high within the four largest provinces (Ontario, British Columbia, Alberta, and Quebec), which follows from the relatively larger sample size of the JVWS in these jurisdictions.
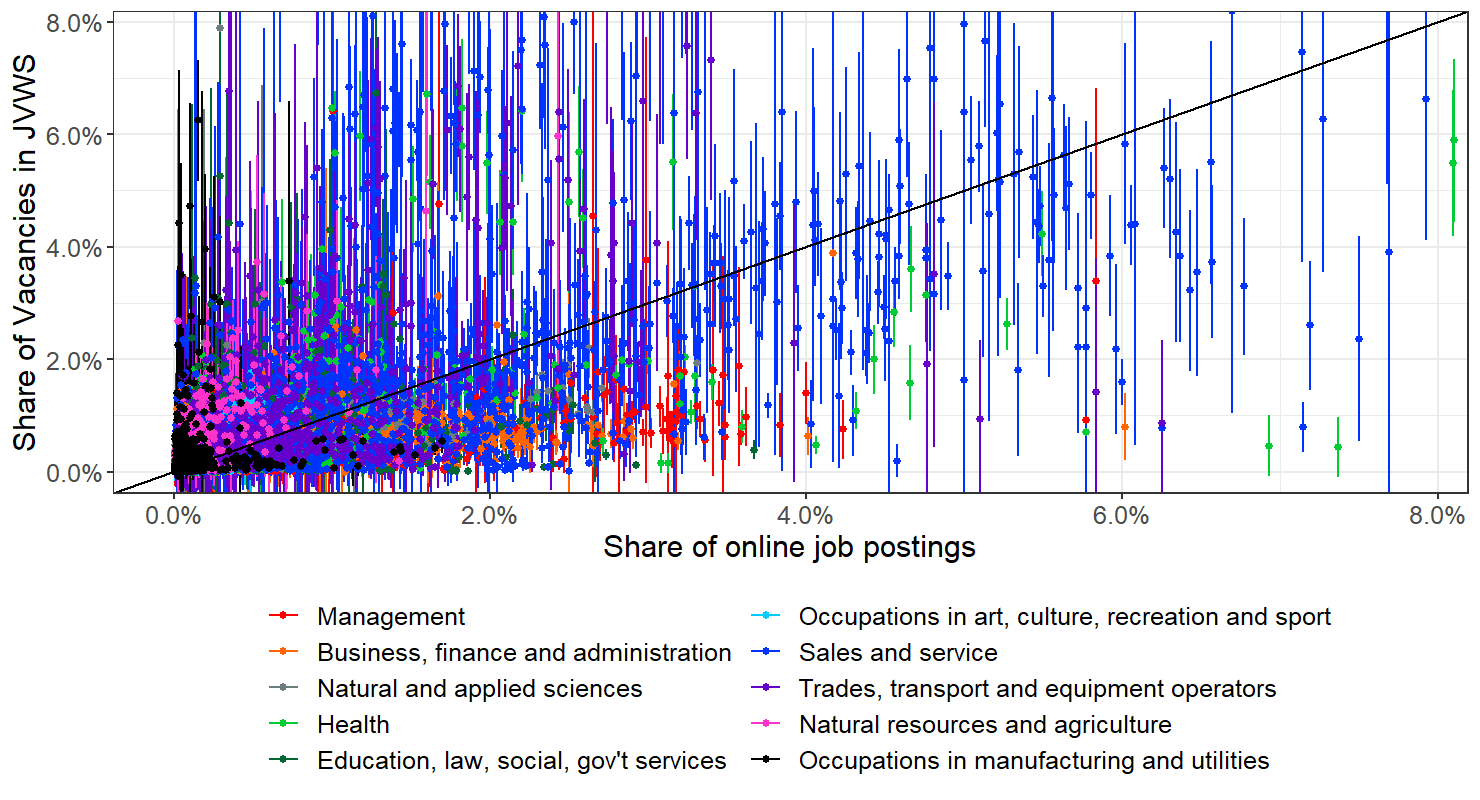
Furthermore, at the provincial level, for occupations in 1) art, culture, recreation and sport (NOC 5) and 2) sales and service (NOC 6), over half of occupational shares at the 1-digit level are accurately represented online (see Table 5 in Appendix C). At the 4-digit level of analysis, 77% of occupations are accurately represented online (see Figure 8 in Appendix B). At this level, for all broad occupational categories, most occupations are accurately represented online (see Table 2). The reason behind this somewhat counterintuitive result — that job posting data appear more accurate within provinces than across the country and more accurate at the 4-digit NOC level than the 1- and 2-digit levels — is due to the increasing sampling error of surveys at more detailed levels of analysis. At the provincial or local level, the underlying number of observations used to estimate the number of vacancies is reduced, which decreases the certainty of the estimate. At the provincial 4-digit NOC level, the 95% confidence intervals increase to such an extent that online job posting observations fall well within the JVWS’s margin of error.
Table 2: Within Provinces and Territories, Online Job Posting Shares Do Not Significantly Differ from JVWS Estimates
Provincial and territorial level of unit groups (NOC 4) of online job posting shares that are above, below or within the 95% confidence interval of the JVWS shares, by quarter. 5
| Broad occupational categories | % not significantly different | % significantly underrepresented online | % significantly overrepresented online |
| NOC 4 level | NOC 4 level | NOC 4 level | |
| 0 – Management occupations | 70% | 8% | 22% |
| 1 – Business, finance and administration occupations | 71% | 5% | 24% |
| 2 – Natural and applied sciences and related occupations | 78% | 7% | 15% |
| 3 – Health occupations | 75% | 6% | 19% |
| 4 – Occupations in education, law and social, community and government services | 75% | 11% | 14% |
| 5 – Occupations in art, culture, recreation and sport | 86% | 3% | 11% |
| 6 – Sales and service occupations | 71% | 14% | 15% |
| 7 – Trades, transport and equipment operators and related occupations | 83% | 9% | 8% |
| 8 – Natural resources, agriculture and related production occupations | 81% | 17% | 2% |
| 9 – Occupations in manufacturing and utilities | 82% | 13% | 5% |
A Detailed Look at Education and Geography
The distribution of online job postings and vacancies by occupational group appear to show a consistent pattern in which management and professional occupations are overrepresented online whereas manual labour and trades are underrepresented. These results are consistent with a previous study from the US showing that 80–90% of job openings requiring a university degree are posted online; 30–40% for college or associate degrees; and 40–60% for high school diplomas.
In this section, we explore this education-specific dimension to online job postings. While we do not have access to data for directly comparable figures, we can compare the share of online job postings and vacancy estimates from the JVWS by education level typically required.
In Canada, the education level typically required for an occupation is identified by the first two digits of the NOC code and is referred to as “skill level” (see Table 3). Using this classification system, we assign an education level to each online job posting linked to a detailed occupation. Management occupations are not formally tied to university education in this NOC system but are often included within skill level A. Here we distinguish between management occupations and other occupations included under skill level A.
Across Canada, management and occupations requiring a university degree or college education (i.e., skill levels 0, A and B) are overrepresented in the online job posting data relative to the JVWS. Jobs that require a secondary school education or on-the-job training (i.e., skill levels C and D) are underrepresented (see Figure 4). Specifically, 10% of online job postings fall under the management category versus 5% in JVWS vacancies; 17% require a university education (13% in JVWS), 30% require a college education, specialized training or apprenticeship training (28% in JVWS), 32% require secondary school and/or occupation-specific training (34% in JVWS), and 11% require on-the-job training (20% in JVWS).
Table 3: Education and Training Required Based on Skill Types
| Skill level | Education/training level |
| 0 | Management occupations. These are not explicitly associated with an education level. Note that this “skill level” is often grouped together with level A |
| A | University degree at the bachelor’s, master’s, or doctorate level |
| B | Occupations usually require college education, specialized training or apprenticeship training |
| C | Occupations usually require secondary school and/or occupation-specific training |
| D | On-the-job training is usually provided for occupations |
Figure 4: Management and occupations with education levels A and B are overrepresented online; occupations with education levels C and D are underrepresented.
Distribution of occupations in online job posting data by education, Canada-wide, all quarters.6
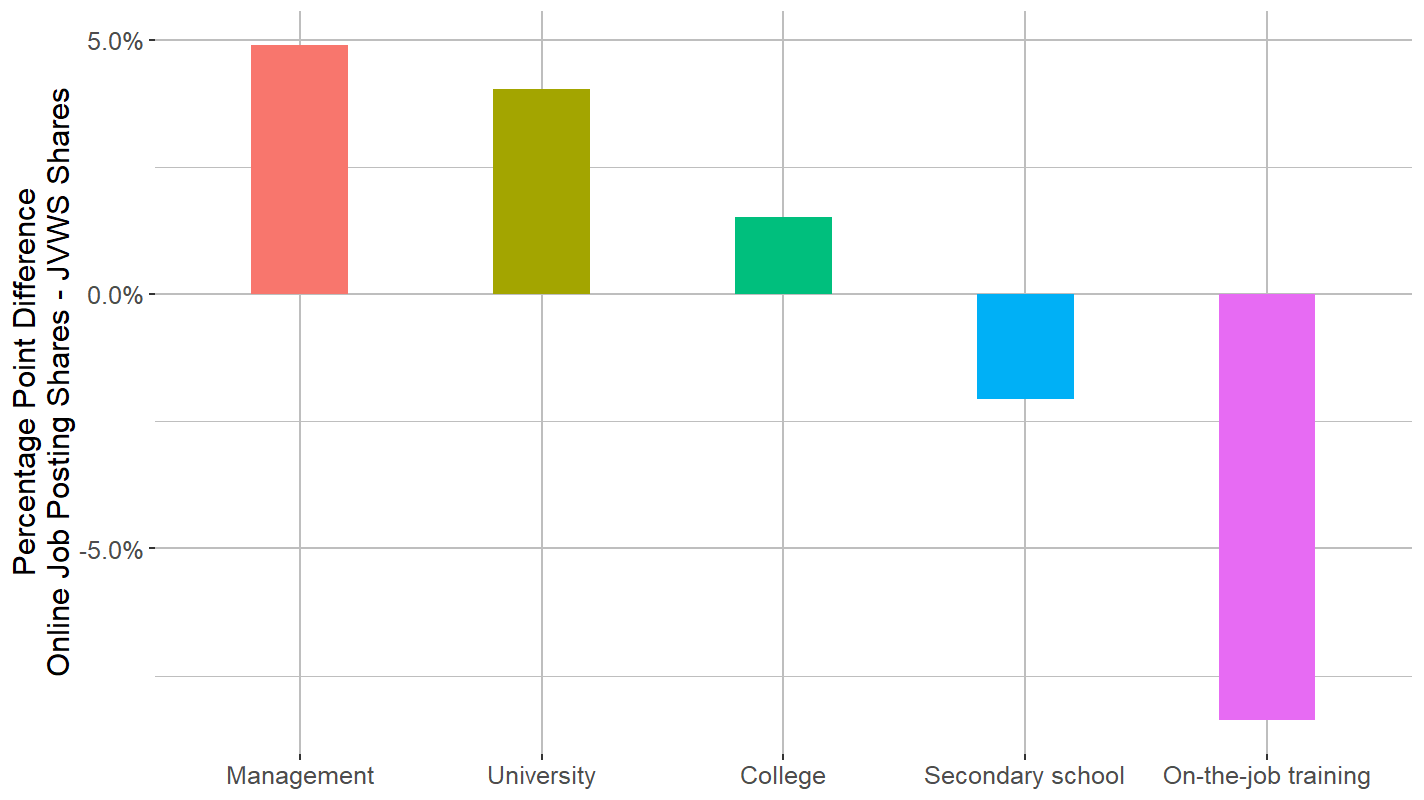
These findings are consistent with what we observe in the previous figures: management and professional occupations and education level A are overrepresented in online job posting data, while education levels C and D are underrepresented. Skill level B (occupations requiring a college diploma) are slightly overrepresented. These results also align with an Australian study, which found that jobs requiring vocational education and training are underrepresented in Australian online job posting data.
In addition to this skewness in education, there is also evidence that online job postings overrepresent larger metropolitan areas and underrepresent smaller regions. To determine whether Canadian online job postings overrepresent metropolitan areas, shares of job openings in the three largest — Toronto, Vancouver and Montreal — are compared to every other metropolitan and non-metropolitan area.7
Canadian online job postings underrepresent Toronto, Vancouver, and Montreal and overrepresent other metropolitan areas and non-metropolitan areas (see Figure 5). Specifically, 38% of online job postings are in the three biggest cities versus 45% of official vacancies per the JVWS. In the remaining metropolitan regions, 50% of online job postings are observed versus 48% of job vacancies. In non-metropolitan regions, 12% of online job postings are observed versus only 8% of job vacancies. One possible explanation for this confounding result, particularly for the overrepresentation online of non-metro areas, may be undercoverage in the JVWS. Undercoverage is a type of non-sampling error that occurs when the information on a location is incomplete in the Business Register, the statistical register used to generate the JVWS sample. This happens for smaller locations that have not yet filed payroll deduction forms with the Canada Revenue Agency.
Figure 5: Online job postings underrepresent metro areas and big cities (Toronto, Montreal and Vancouver) while overrepresenting non-metropolitan areas.
Distribution of occupations in online job posting data by region, all quarters.8
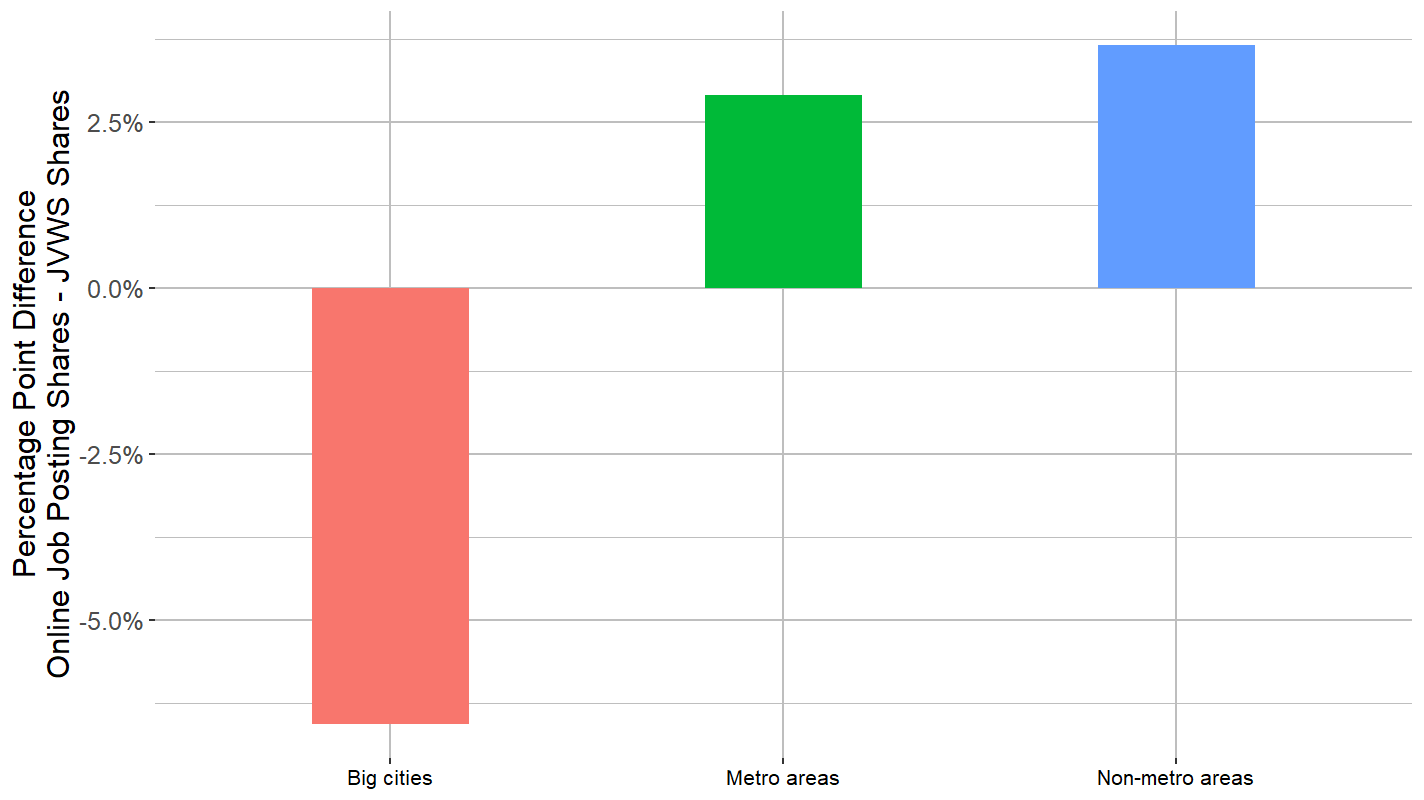
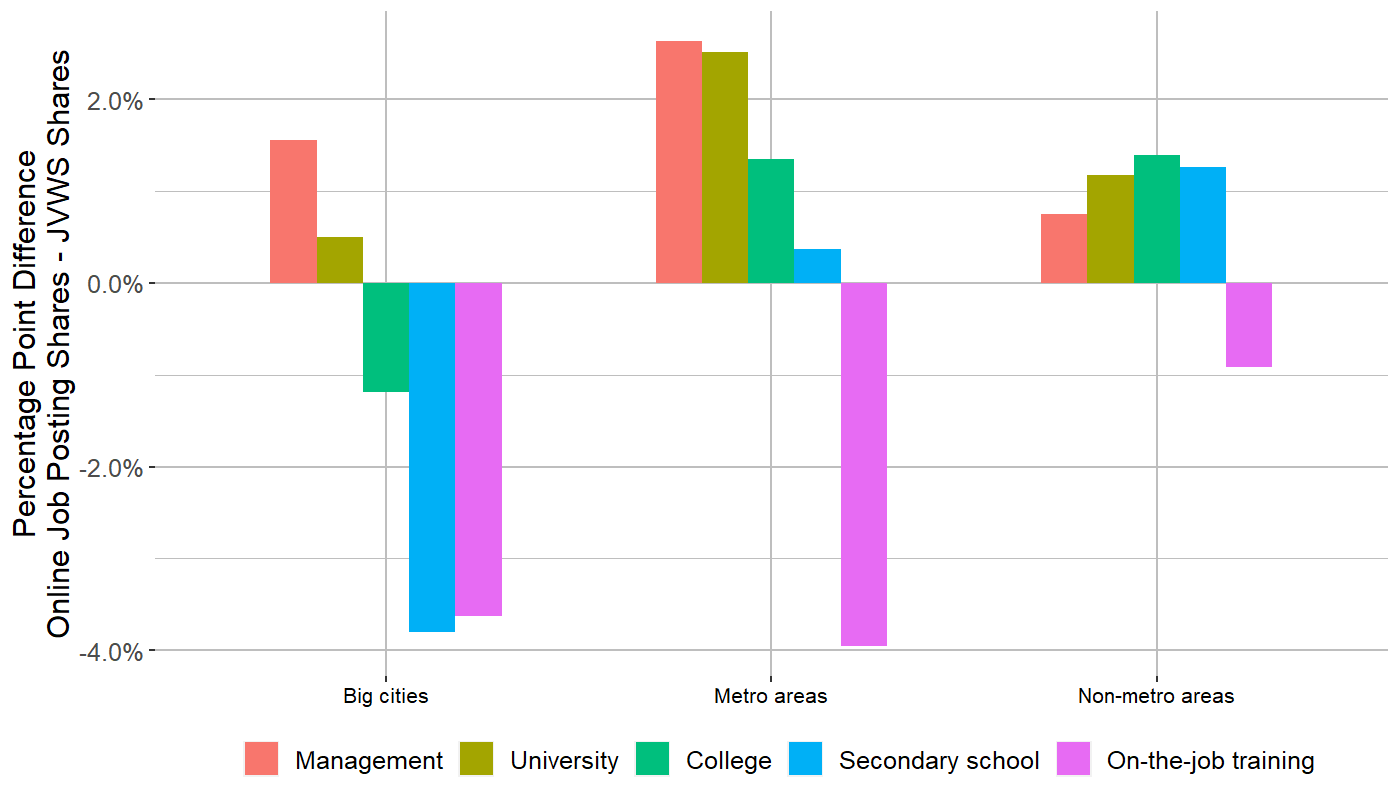
When grouping by both education level and geography, we observe that management and university occupations are overrepresented in each type of location and on-the-job training is underrepresented in each, meaning that these occupations are consistently over/underrepresented online across all geographies (see Figure 6). For big cities, occupations that require a college degree or less drive the online underrepresentation for these locations that we see in Figure 5. The results are slightly less confounding because as expected, management and university occupations in big cities (and all other geographies) are overrepresented online.
Figure 6: Online job postings consistently overrepresent management occupations for all three urban indices.
Distribution of occupations in online job posting data by education and region, Canada-wide, all quarters.9
The Way Forward
Online job postings are a valuable complement to official job vacancy statistics since they provide information that traditional surveys do not capture, such as insights on the work requirements of jobs, including skills, that employers are seeking in near real-time at both local and granular levels. Online job postings can also be analyzed at a fraction of the cost of traditional survey methods.
For these reasons, LMIC launched an interactive dashboard, called the Canadian Online Job Posting Dashboard. The dashboard allows users to look up the number of job postings in near real-time by geographic region and by occupation, and identifies work requirements detailed by employers in the job postings. However, like all data sources, the caveats and limitations should be transparent to ensure the decision-making process is as informed as possible.
In terms of representativeness, online job postings overrepresent management and service-sector professions requiring university education and underrepresent the trades and other jobs that require a secondary school education or on-the-job training. Online job postings are also underrepresented in the three largest cities in Canada – Toronto, Montreal, and Vancouver – but are skewed towards other metropolitan and non-metropolitan locations. There are other limitations; for example, employers in different sectors of the economy recruit in different ways. Small firms and those working in sectors like agricultural are more likely to hire by word of mouth than to post online. Also, there is no way to tell which work requirements are critical for the position in question. The data only allows us to observe that certain requirements are more frequently stated by employers across online job postings. These other limitations — along with the considerable benefits that online job postings offer — are discussed in more detail in LMI Insight Report No. 32.
Overall, online job posting data is an excellent complement to existing data sources.
Acknowledgments
This LMI Insight Report was prepared by Zoe Rosenbaum and Brittany Feor of LMIC. We thank Sandip Basi and Steven Wald (Government of Ontario), Felix Bélanger-Simoneau (Observatoire compétences-emplois), Veronica Escudero and Hannah Liepmann (International Labour Organization), Austin Hracs (Magnet), Fabian Lange (McGill University), Martin Lemire and Dominique Dionne-Simard (Statistics Canada), Naomi Pope and Amy Wongkanlayanush (Government of BC), and David Ticoll (University of Toronto) for their feedback.
For more information about this report or other LMIC activities, please contact Zoe Rosenbaum, Economist (zoe.rosenbaum@lmic-cimt.ca), Brittany Feor, Economist (brittany.feor@lmic-cimt.ca) or Tony Bonen, Director of Research, Data and Analytics (tony.bonen@lmic-cimt.ca). Your feedback is welcome. We invite you to provide your input and views on this subject by emailing us at info@lmic-cimt.ca.
Appendix A: Calculations
Calculation of Shares
Note: “job openings” refer to online job postings and job vacancies since we calculated the same shares for both data sources.
| Pan-Canadian shares |
|
| Provincial shares |  where i is a specific NOC code and k is a province. |
| Educational ("skill") level shares |  where j is a skill level: 0, A, B, C or D. |
| Urban Index shares |  where z is urban location: big city, metro area or non-metro area |
Calculation of Confidence Intervals
| Confidence Intervals |
Statistics Canada defines the coefficient of variation (CV) as the standard error (SE)11 as a percentage of the estimate (m).12 Therefore, to calculate the standard errors, we just multiply the CV times the estimate. Then, we calculate the confidence intervals at 95% with the usual formula, namely: |
Appendix B: Figures
The x and y axis of each figure are the occupational shares of online job postings and JVWS job vacancies, respectively. Each point indicates the relative occupational shares for each data source, and the error bars are the 95% confidence intervals derived from JVWS. If the occupational share of each data source is equal, then the point lies on the 45-degree line, whereas, if the occupational share is higher in JVWS, the point moves above the 45-degree line and is considered underrepresented in online job postings. If the occupational share is lower in JVWS, the point moves below the 45-degree line and is considered overrepresented in online job postings. Every occupation that is either over or underrepresented is coloured based on its 1-digit NOC code. If the difference between the occupational share in online job postings data and in the JVWS is not statistically significant at the 5% level, then that share is indicated as “NS.”
Figure 7: At the 4-digit NOC and pan-Canadian level, 31% of observations are overrepresented online, 29% are underrepresented and 40% are not statistically different between online job posting data and the JVWS.
Distribution of online job postings and JVWS vacancies, Canada-wide, quarterly.
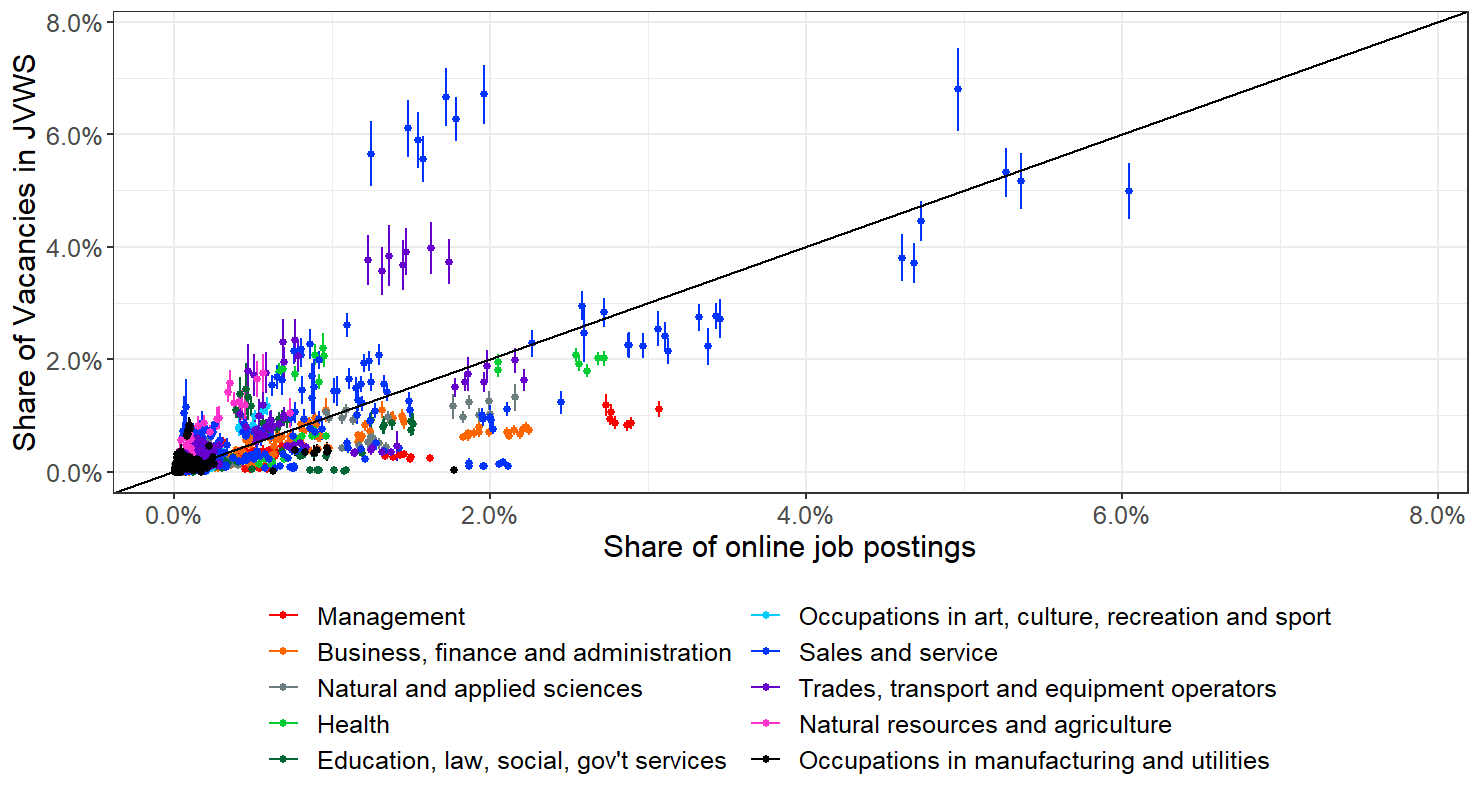
Figure 8: At the 4-digit NOC and provincial level, 14% of observations are overrepresented online, 9% are underrepresented and 77% are not statistically different between online job posting data and the JVWS.
Distribution of online job postings and JVWS vacancies, Canada-wide, quarterly.
Appendix C: Tables
Table 4: Across Canada, Online Job Postings are Not Representative at the 1-digit Level
Pan-Canadian share of broad occupational categories (NOC 1) of online job postings that are above, below or within the 95% confidence interval of the JVWS shares, by quarter.12
| Broad occupational categories | % not significantly different | % significantly underrepresented online | % significantly overrepresented online |
| NOC1 Level | NOC1 Level | NOC1 Level | |
| 0 – Management occupations | 0% | 0% | 100% |
| 1 – Business, finance and administration occupations | 0% | 0% | 100% |
| 2 – Natural and applied sciences and related occupations | 0% | 0% | 100% |
| 3 – Health occupations | 14% | 0% | 86% |
| 4 – Occupations in education, law and social, community and government services | 0% | 0% | 100% |
| 5 – Occupations in art, culture, recreation and sport | 71% | 29% | 0% |
| 6 – Sales and service occupations | 0% | 100% | 0% |
| 7 – Trades, transport and equipment operators and related occupations | 0% | 100% | 0% |
| 8 – Natural resources, agriculture and related production occupations | 0% | 100% | 0% |
| 9 – Occupations in manufacturing and utilities | 0% | 100% | 0% |
Table 5: Within Provinces and Territories, Online Job Posting Shares are More Accurately Representative than at the Pan-Canadian Level
Pan-Canadian share of broad occupational categories (NOC 1) of online job postings that are above, below or within the 95% confidence interval of the JVWS shares, by quarter.13
| Broad occupational categories | % not significantly different | % significantly underrepresented online | % significantly overrepresented online |
| NOC 1 level | NOC 1 level | NOC 1 level | |
| 0 – Management occupations | 11% | 1% | 88% |
| 1 – Business, finance and administration occupations | 22% | 3% | 75% |
| 2 – Natural and applied sciences and related occupations | 45% | 9% | 46% |
| 3 – Health occupations | 25% | 17% | 58% |
| 4 – Occupations in education, law and social, community and government services | 43% | 13% | 44% |
| 5 – Occupations in art, culture, recreation and sport | 70% | 11% | 19% |
| 6 – Sales and service occupations | 48% | 46% | 6% |
| 7 – Trades, transport and equipment operators and related occupations | 42% | 55% | 3% |
| 8 – Natural resources, agriculture and related production occupations | 21% | 77% | 2% |
| 9 – Occupations in manufacturing and utilities | 26% | 70% | 4% |
Table 6: Shares of Job Vacancies in the JVWS and Online Job Postings per Broad Occupational Category (NOC 1)
| Broad Occupational Category | Share of job vacancies in the JVWS (%) | Share of online job postings (%) |
| 0 – Management occupations | 5.2% | 10.2% |
| 1 – Business, finance and administration occupations | 10.9% | 16.6% |
| 2 – Natural and applied sciences and related occupations | 7.5% | 8.6% |
| 3 – Health occupations | 6.8% | 7.9% |
| 4 – Occupations in education, law and social, community and government services | 6.2% | 7.6% |
| 5 – Occupations in art, culture, recreation and sport | 2.2% | 2% |
| 6 – Sales and service occupations | 33.6% | 29.6% |
| 7 – Trades, transport and equipment operators and related occupations | 18.3% | 12.6% |
| 8 – Natural resources, agriculture and related production occupations | 3.9% | 1.3% |
| 9 – Occupations in manufacturing and utilities | 5.4% | 3.6% |
End Notes
- The latest period for which the JVWS data are available. Release of more recent JVWS observations was postponed due the COVID-19 pandemic.
- This figure is based on the share of online job postings associated with an industry category. This is only an approximation since nearly 60% of job postings cannot be accurately associated with an industry group and we therefore do not know the distribution of job postings by industry for these cases.
- For the purposes of this analysis, Statistics Canada provided JVWS sample error estimates (reported as coefficients of variation) to LMIC.
- Calculation details are available in Appendix A.
- Calculation details are available in Appendix A.
- Calculations are available in Appendix A.
- These urban classifications are based on Economic Regions since it is the most detailed level of geography available in the JVWS. “Big Cities” include the economic regions of Toronto, ON, Mainland/Southwest, BC, and Montreal, QC. “Metropolitan Areas” consist of economic regions (excluding the three cities listed above) with a CMA with the addition of Fredericton-Oromocto, NB . “Non-metropolitan Areas” are Economic Regions that do not include a CMA with the addition of Interlake, MB. To check for robustness, Figures 5 and 6 were recreated with “Big cities” for the same economic regions – Toronto, Mainland/Southwest, and Montreal – but “Metropolitan areas” for every other economic region with a population density greater than 5.0 per km2 and a population greater than 100,000 and “Non-metropolitan areas” for the remaining regions. These results are the same, with occupations in big cities underrepresented online and occupations in metro and non-metro areas overrepresented.
- Calculations are available in Appendix A.
- Calculations are available in Appendix A.
- Standard error is the standard deviation divided by the square root of the sample size.
- https://www150.statcan.gc.ca/n1/pub/71-543-g/2012001/part-partie7-eng.htm
- Calculation details are available in Appendix A.
- Calculation details are available in Appendix A.
 where i s a specific NOC code.