
Untangling Vacancy Data
As unemployment drops to historic lows (5.5% as of June 2019), the background conversation on labour and skills shortages has been propelled to the forefront. As noted by my colleague Anthony, finding the right indicator, or combination of indicators, to identify and monitor labour shortages, skill shortages, and skill mismatches is a major challenge.
In addition to the ever-present unemployment rate, job vacancies are commonly used and picked up by market watchers, policy makers and the media. Job vacancies shed light on the unmet labour demand by counting the number of workers that employers are trying to recruit. When added to the level of employment – i.e., the demand for workers that has been met– one obtains total labour demand (met demand plus the unmet demand as measured by vacancies).
A Long-Standing Gap
Although a great indicator of shortages in theory, the true number of job vacancies is challenging to accurately gauge. Several approaches have been tested and implemented in Canada.
Up until the early 2010s, Canadians mainly relied on private data sources such as the Canadian Federation of Independent Business’s (CFIB) Your Business Outlook Survey to observe vacancies. From 1962 to 2003, Statistics Canada also produced a measure of vacancies based on job ads published in 22 metropolitan area newspapers, known as the Help Wanted Index. These sources were not statistically representative of the Canadian economy, and lacked local insights (provincial estimations only) and granularity (no information on occupations). Echoing the concerns of employers and policy makers, the final report from the 2009 Advisory Panel on Labour Market Information called for the implementation of a national vacancy survey.
In 2011, the Survey of Employment, Payrolls and Hours (SEPH) was expanded to include the Job Vacancy Statistics (JVS) component, which provides a monthly portrait of the level of job vacancies by province and industry. This constituted the first official survey on job vacancy statistics in Canada, but gaps remained. Again, data users eschewed the lack of local, granular insights as the survey was not designed to provide information on occupations or for regions within provinces. To collect much-needed information at the sub-provincial level, several provinces put in place their own employer survey including Alberta, Saskatchewan (between 2002 and 2013) and Quebec.
Moreover, SEPH estimates were criticized for underestimating the volume of unoccupied positions in the economy. As a result, users continued to rely on private and in-house estimations creating confusion in the already heated debate on labour shortages.
In response, Statistics Canada collaborated with Employment and Social Development Canada (ESDC) to launch the Job Vacancy and Wage Survey (JVWS) in 2015. The JVWS offers quarterly estimates of the number of job vacancies and vacancy rates by economic region and for detailed National Occupational Classifications (NOC). In turn, the Job Vacancy Statistics (JVS) collected as part of SEPH is slated to be discontinued by the end of 2019.
The JVWS is now recognized as the main pan-Canadian source for job vacancies, and will soon be the sole source of vacancy estimates produced by Statistics Canada.
Different Estimations
As noted, vacancies are notoriously challenging to accurately measure, which can raise concerns in terms of comparability. We compare here the vacancy estimates for the three most commonly cited pan-Canadian surveys – the CFIB survey, SEPH and JVWS. Each survey generates significantly different estimates of vacancies. However, the differences among the three are relatively consistent over time: The JVWS systematically estimates the highest level of vacancies – anywhere between 25 and 40% greater than the CFIB estimate, and almost double the levels estimated in the SEPH. The consistency of these differences suggests the differences are attributable to differences in the underlying survey methodologies.
Figure 1: Higher Vacancies Estimations with JVWS and CFIB than SEPH
Job vacancy estimates from SEPH1, JVWS and CFIB for 2015 Q2 to 2019 Q1
Source: Survey of Employment, Payrolls and Hours, Statistics Canada, table 14-10-0224; Job Vacancy and Wage Survey, Statistics Canada, table 14-10-0325-01; Help Wanted Private sector job vacancies, Canadian Federation of Independent Business, available here
Note 1: Since SEPH is a monthly estimator, the average of monthly estimates of job vacancies for the quarter are presented.
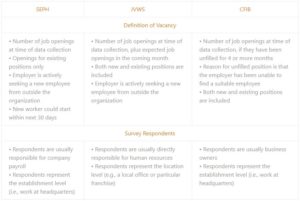
Indeed, each survey takes a different approach in two important aspects: (a) the definition a vacancy and; (b) the profile of respondents. Table 1 provides a summary of these differences.
Table 1: SEPH, JVWS, CFIB Definition and Respondent Differences
Finding the ‘One’
Job vacancy data can be used for a variety of purposes, but how do we choose the right data source? How do we report correctly on such labour market conditions?
In designing a data collection tool, providers need to consider the balance between the reliability of each indicator, its timeliness, granularity and localness. In other words, each survey will have its own set of limitations, such as sample size or questionnaire design. It is important to keep in mind that each source was designed to serve a specific purpose. As such, the choice of data source will ultimately depend on which features are the most important to you and your research.
It is important to first look at the key indicator the survey was designed to collect. For instance, the main objective of the SEPH is to provide a picture of the evolution of job vacancies over time. Conversely, the JVWS is designed to accurately capture the true number of vacancies in each quarter. Finally, provincial surveys primarily focuses on characterizing vacancies within occupations and sub-provincial regions.
Figure 2: How to Choose a Vacancy Source
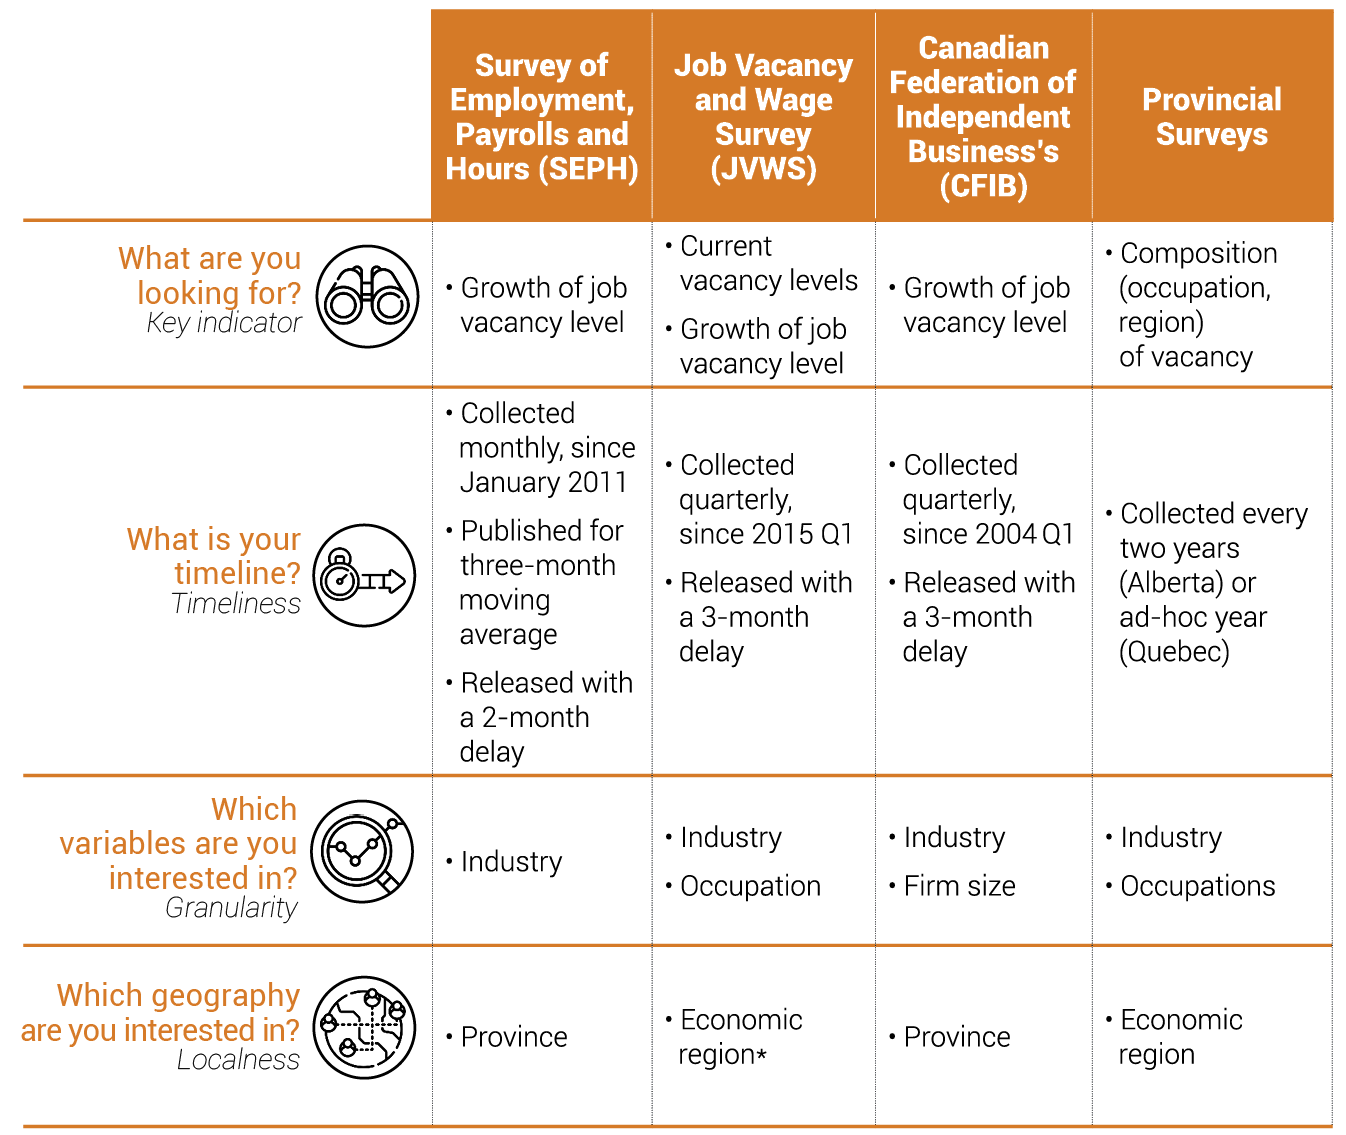 *Note: JVWS sample was designed to be representative across all 76 economic regions (ER) of the Standard Geographical Classification (SGC). For publication, seven smaller regions are combined to produce better estimates and estimates are published for 69 regions.
What’s Next
Statistics Canada job ads based Help Wanted Index was terminated because information collected though newspaper became irrelevant with the broader use of online postings. But the idea of using job postings as a proxy for job vacancies has not been abandoned. Indeed, there is now a great wealth of job posting data available on public websites.
Extracting, cleaning and analyzing job postings through machine learning and data mining techniques has opened the door for a broad new range of data products and insights. At LMIC we are exploring these new sources of information, identifying analytical opportunities and data limitation to better understand the Canadian labour market. To that end, we recently established a partnership with Vicinity Jobs to access a unique database of real-time job postings from across Canada. By providing highly localized and timely data, the scraped job posting data will enable us to share actionable insights with educators, policy makers, research and the broader Canadian public. Stay tuned!

Emna Braham is a Senior Economist with LMIC. She is currently working to assess the state of labour market information in Canada and conducting forward-looking research in collaboration with stakeholders.