The Search for Data on LGBTQ2S+ Workers
As an ally to LGBTQ2S+ people, I am thrilled to share the most recent report from the Social Research Demonstration Corporation (SRDC) exploring labour market outcomes of gender and sexual minorities in Canada.
The data in this report represent a major step forward in highlighting the lack of labour market information (LMI) about LGBTQ2S+ people in Canada.
The report analyzes the differences in socio-demographic, employment, and health and well-being characteristics between three groups of sexual minorities—lesbian, gay and bisexual—and heterosexual men. As shown in Figure 1, there is a large earnings gap between most sexual minorities and heterosexual men.
Where did the data come from?
The data in the report come from the Canadian Community Health Survey (cycles 2003, 2005, and 2007 to 2018) and taxfiler data (from the T1 Family File for 2003 to 2017). These data represent some of the highest-quality information on annual income for lesbian, gay and bisexual people in Canada.
Unfortunately, there are some limitations to the data in the report, including lack of information on hourly wages, hours worked and occupations. (See our report on the limitations of the T1 Family File.)
Until recently, LMI specific to LGBTQ2S+ people has been sorely lacking in Canada. Thankfully, this will start to change with the release of Census 2021 data, which will include LMI by gender and sexual orientation for the first time.
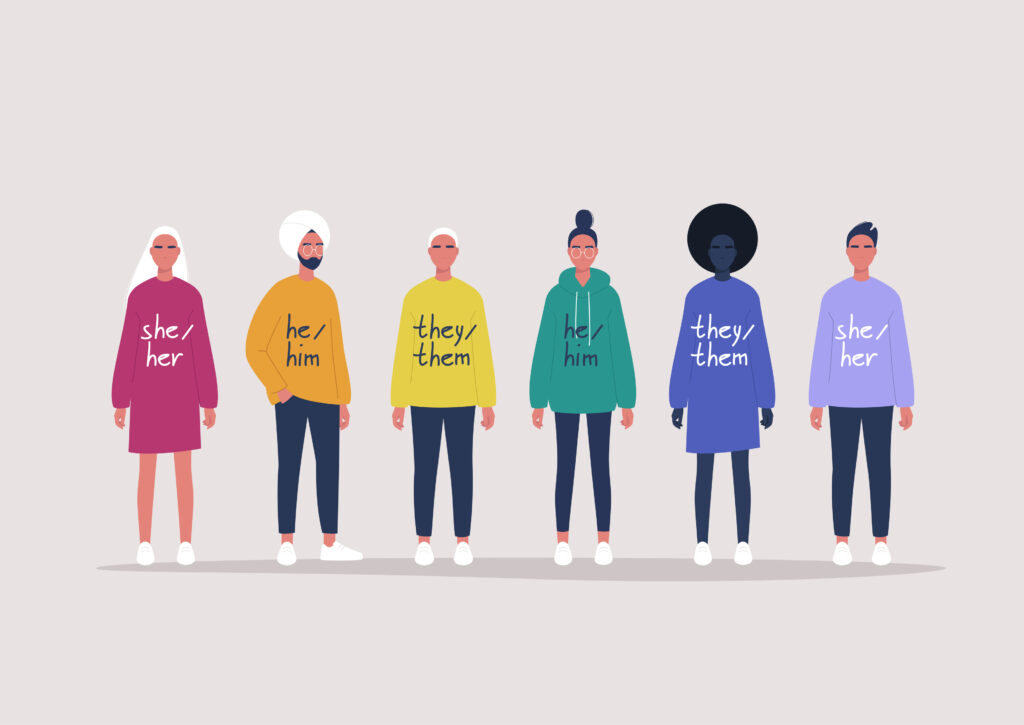
LGBTQ2S+ is a community, not a single entity
As noted, research shows that individuals who self-identify as lesbian, gay or bisexual have significantly lower median annual earnings than heterosexual men.
They also experience other inequities, such as lower levels of general and mental health (with increased stress and food insecurity) and lower rates of life satisfaction, job satisfaction and community belonging.
Figure 1, based on more than 300,000 observations, shows significant income disparities for sexual minorities, particularly in comparison to heterosexual men.
Heterosexual men generally earn the most of any group ($55,959), followed by gay men ($50,822), lesbian women ($44,740) and heterosexual men ($39,180), while bisexual men ($31,776) and women earn the least ($25,290).
These gaps remain even when controlling for education. That said, after controlling for other factors the difference between heterosexual and gay men was not statistically significant.
An important take-away is that the LGBTQ2S+ community should not be treated as a single entity.
Earnings gaps and other outcomes for people who self-identify as bisexual were consistently found to be the poorest in these data: bisexual women and men earn only 45% and 57%, respectively, of what heterosexual men earn, and 50% and 63% of what gay men earn.
Similar to what was discussed in Double Penalty: Being a Woman and a Visible Minority, being a woman and bisexual can be a double penalty for some individuals.
Figure 1 – Earnings among sexual orientations: heterosexual men earn the most and bisexual women earn the least
Annual earnings (median) by sexual orientation and sex

Source: Social Research Demonstration Corporation calculations in the report - Statistics Canada, Canadian Community Health Survey linked to the T1 Family File.
What drives earnings differences?
Among all the drivers for these earnings differences, the key factors are occupation, job industry, mental health and hours worked. And while the drivers of earnings gaps cannot be fully explored with the available data, the findings reinforce the holistic approach to addressing inequities.
The way forward
SRDC’s current report includes data from the second phase of a project funded by Women and Gender Equality Canada in partnership with the University of Western Ontario, Pride at Work Canada and LMIC.
The goal is to address gaps in data and research with regards to the link between sexual orientation and economic, health and social outcomes in Canada. The data provided throughout this project are extremely significant in helping us understand and address the inequities that exist for LGBTQ2S+ people. Results from the 2021 Census will be available in late 2022, and will hopefully contain even more data on sexual orientation and LMI by gender.
In addition, earlier this year, the Canadian Community Health Survey and Statistics Canada introduced a two-step gender question to explore the experiences of gender and sexual minority individuals.
Finally, the Survey of Safety in Public and Private Spaces provides data on sexual orientation and labour market outcomes on a five-year cycle, with the next report due in 2023. Although these initiatives signal progress, researchers need more timely and granular data on sexual minorities to be able to tell the full story.
Going forward, LMIC remains committed to supporting the great work being done through SRDC’s project and to sharing its findings with Canadians.
For additional information, download key LMI data (Excel format) and the SRDC report.

Behnoush Amery is a senior economist at LMIC.
She brings expertise in quantitative analyses and conducts labour-related projects such as gender analysis and labour market outcomes of students.